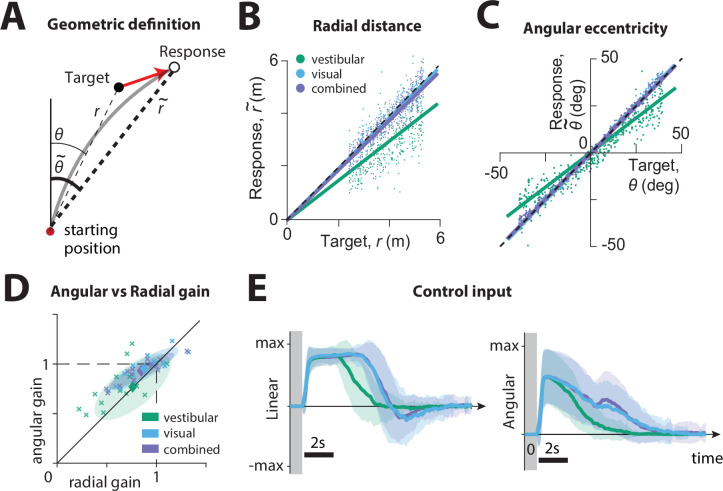
Figure 2. Effect of sensory modality on participants' responses.
(A) Geometric definition of analysis variables.
The gray solid line indicates an example trajectory. The target and response distance and angle relative to the starting position of the participant are given by (thin lines) and (thick lines), respectively. (B C) Example participant: Comparison of the radial distance of an example participant’s response (final position) against the radial distance of the target (B), as well as the angular eccentricity of the participant’s response vs. target angle (C), across all trials for one participant, colored according to the sensory condition (green: vestibular, cyan: visual, purple: combined visual and vestibular; Figure 2—source data 1). Radial and angular response gains were defined as the slope of the corresponding regressions. Black dashed lines show unity slope, and the solid lines represent slopes of the regression fits (intercept set to 0). (D) All participants: Radial and angular gains in each sensory condition plotted for each individual participant (Figure 2—source data 2). Ellipses show 68% confidence intervals of the distribution of data points for the corresponding sensory condition. Diamonds (centers of the ellipses) represent the mean radial and angular response gains across participants. Dashed lines indicate unbiased radial or angular position responses. Solid diagonal line has unit slope. (E) Magnitudes of radial and angular components of control inputs across sensory conditions for an example participant. Shaded regions represent ±1 standard deviation across trials. The gray zone corresponds to the target presentation period.


