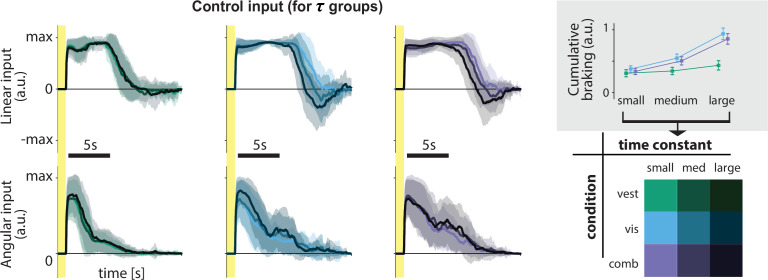
Figure 4. Linear and angular control inputs for each condition grouped based on the time constant (see legend; bottom right), for an example participant.
Shaded regions represent ±1 standard deviation across trials. Yellow zones denote target presentation period. Inset: Cumulative braking (i.e. absolute sum of negative linear input) for each condition across time constant groups. Braking was averaged across trials. Error bars denote ±1 SEM across participants.

