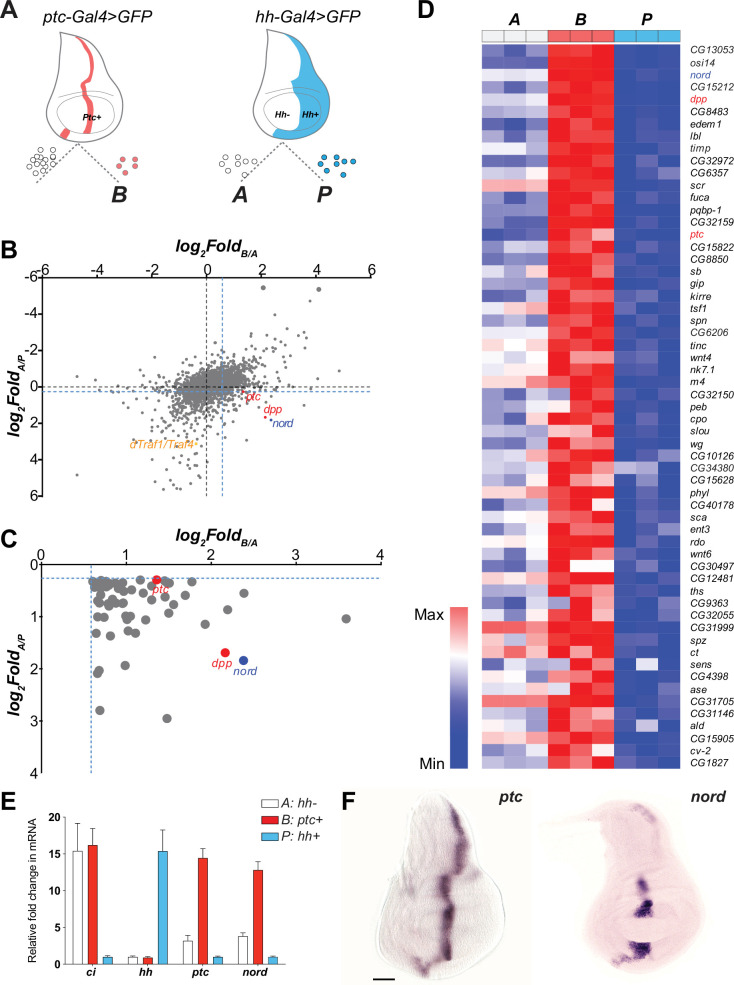
Figure 1. nord is a novel target gene of the Drosophila Hedgehog (Hh) signaling pathway.
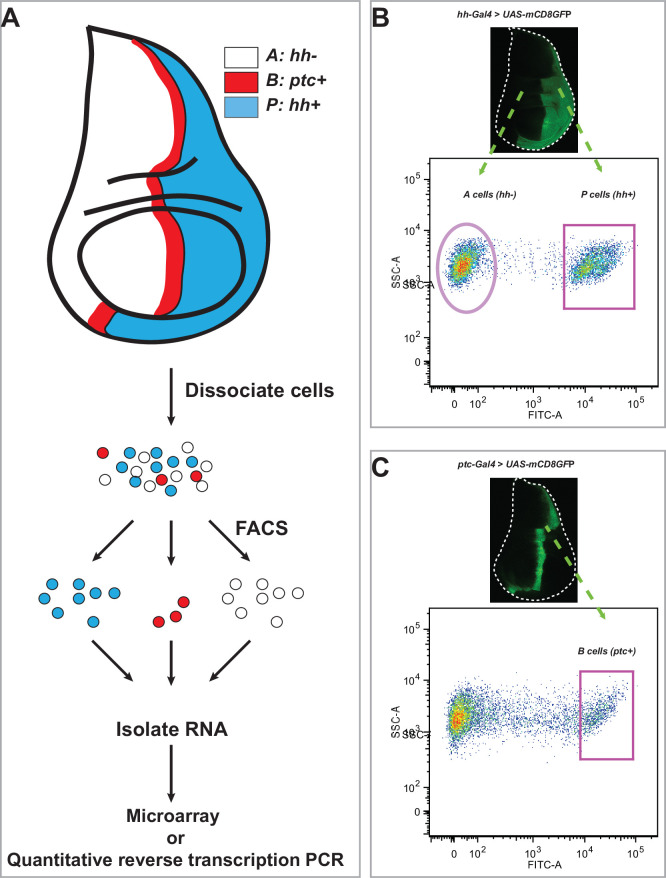
(A) Schematic diagram of Drosophila wing imaginal disc: posterior compartment (P: hh+), anterior compartment (A: hh-), and anterior compartment cells adjacent to the A/P boundary (B: ptc+). A, P, and B cells from wing imaginal discs of third instar larvae carrying hh-Gal4 or ptc-Gal4-driven UAS-mCD8-GFP were dissociated and sorted by fluorescence-activated cell sorting (FACS). RNA was isolated and hybridized to microarrays. Differentially expressed genes were identified. (B) Dot plot shows all 14,448 annotated probe sets. Each dot indicates one probe set. The x-axis represents the log2 fold change of each gene in B vs. A cells, and the y-axis represents the log2 fold change of each gene in A vs. P cells. The blue dash lines indicated the threshold used to select differentially expressed genes in each group. Colored dots indicate known or novel Hh pathway targets dTraf1/Traf4 (orange), dpp (red), ptc (red), and nord (blue) in the graph. (C) Zoomed view of the bottom-right corner in panel (B) to show 59 differentially expressed genes, whose expression is significantly increased in B (ptc+) cells but decreased in P (hh+) cells compared with A (hh-) cells. (D) Heatmap shows the expression level of the 59 top-ranking differentially expressed genes in A, B, and P cells. The fold change in B vs. A cells was used to rank the order. (E) Fold changes of ci, hh, ptc, and nord mRNA expression, measured by quantitative reverse transcription PCR and normalized by the expression of the housekeeping gene pkg, in FACS-sorted A, B, or P cells. (F) In situ hybridization of ptc and nord in the third instar larval Drosophila wing discs. Scale bar, 50 μm.


