. 2022 Jan 17;11:e73357. doi: 10.7554/eLife.73357

Figure 4. Nord is required for proper crossvein patterning and growth of the Drosophila wing.

(A) Upper panel: schematic diagram of the wild-type nord locus, the gene-trap, and the CRISPR alleles of nord. A Minos-Mediated Integration Cassette (MiMIC) cassette consisting of a splice acceptor site followed by stop codons in all three reading frames was inserted into the first coding intron of nord in the nord gene-trap allele nordMI0641. Detailed view of the deleted regions in the nord mutant alleles generated by the CRISPR/Cas9 system. Lower panel: schematic diagram of the human Neuron-Derived Neurotrophic Factor (NDNF) protein, Drosophila Nord protein, and the predicted polypeptide products from the indicated nord mutant alleles. (B) Adult wings obtained from male or female flies with indicated genotypes were pseudo-colored and overlapped to show the size difference. ACV, anterior crossvein; PCV, posterior crossvein; LV, longitudinal veins (L1–L5). (C) Quantification of wing size, distance between distal ends of LVs L2 and L5 (dL2–L5), L3 and L4 (dL3–L4), and the ratio of dL3–L4 /dL2–L5. Each bar shows the mean ± SD from n = 20 wings. All flies were grown at 25°C. One-way ANOVA followed by Sidak’s multiple comparison test or unpaired two-tailed t-test was used for statistical analysis. ***p<0.001, ****p<0.0001, ns, not significant; au, arbitrary units. (D) Adult wings of flies with the indicated genotypes. Yellow arrowhead indicates ectopic vein near posterior crossvein (PCV) or L5. (E) Quantification of the ectopic venation phenotype in adult wings from flies with the indicated genotypes. n > 50. Two-sided Fisher’s exact tests were used for statistical analysis. ***p<0.001, ****p<0.0001, ns, not significant. Scale bar, 500 μm.

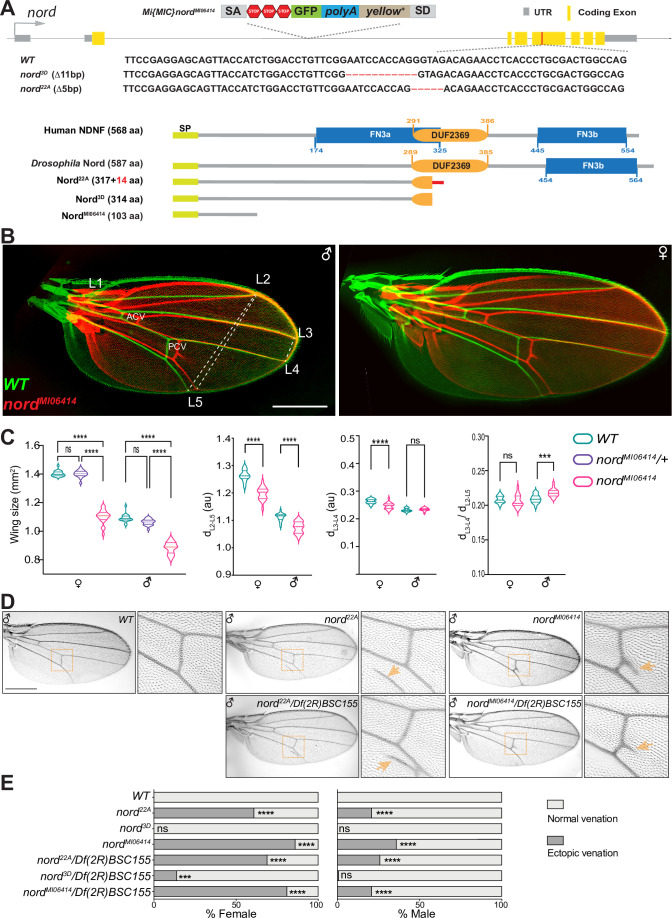
Figure 4.

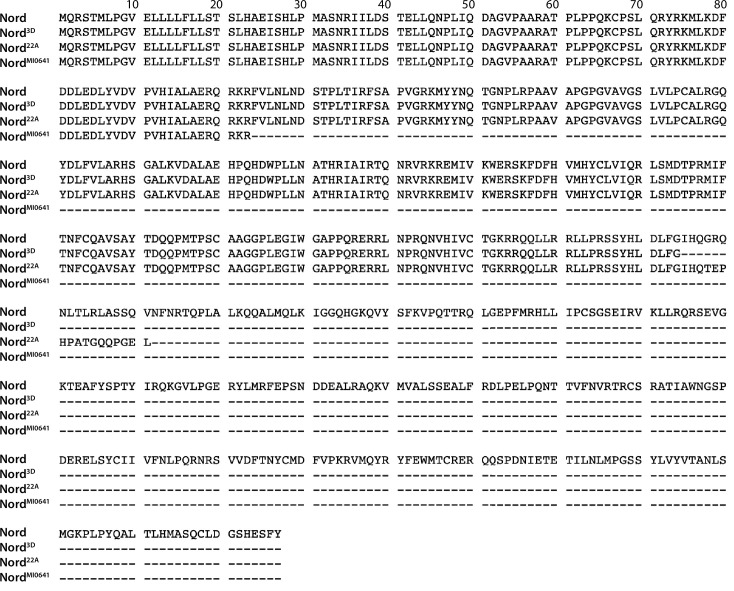
Figure 4—figure supplement 1. Alignment of wild-type and truncated Nord proteins from the wild-type and nord mutant alleles.

Figure 4—figure supplement 1.

Figure 4—figure supplement 2. Nord is required for proper growth of the Drosophila wing.

Figure 4—figure supplement 2.

(A) Overlapped adult wings obtained from male flies with indicated genotypes. Scale bar, 500 μm. (B) Quantification of the size of adult wing from flies with indicated genotypes. Each bar shows the mean ± SD from n > 14 adults wings, and representative images are shown in panel (A). All flies were grown at 25°C. One-way ANOVA followed by Sidak’s multiple comparison test was used for statistical analysis. ****p<0.0001, ns, not significant.
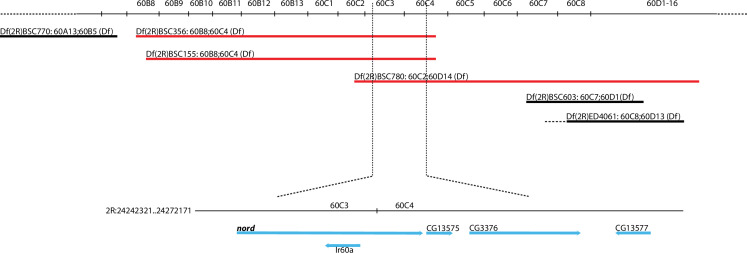
Figure 4—figure supplement 3. Location of deficiency lines used in the complementation test.

Figure 4—figure supplement 3.

Mi{MIC}nordMI06414 allele failed to complement deficiency lines (red) harboring nord deletion for ectopic crossvein formation. The deficiency lines that complemented the Mi{MIC}nordMI06414 allele for ectopic crossvein formation are indicated in black.
Figure 4—figure supplement 4. nord22A and nord3D in trans to Df(2R)BSC155 produced smaller wings compared to controls.

Figure 4—figure supplement 4.

(A, B) Quantification of the size of adult wing from male and female flies with indicated genotypes. Each bar shows the mean ± SD from n > 10 adults wings. All flies were grown at 25°C. The unpaired two-tailed t-test was used for statistical analysis. **p<0.01, ****p<0.0001, ns, not significant.
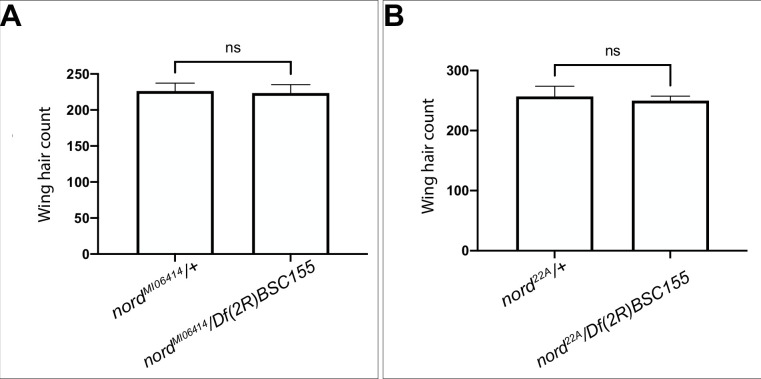
Figure 4—figure supplement 5. Effects of loss of nord on wing trichome density.

Figure 4—figure supplement 5.

(A, B) Quantitation of wing hair cell density in a fixed area in the posterior wing between the L4 and L5 wing veins (see Materials and methods) for nord MI06414/ Df(2R)BSC155 or nord22A/ Df(2R)BSC155 compared to heterozygous (nordMI06414/+ or nord22A/+) controls. Each bar shows the mean ± SD, n = 10. The unpaired two-tailed t-test was used for statistical analysis. ns, not significant (p>0.05).
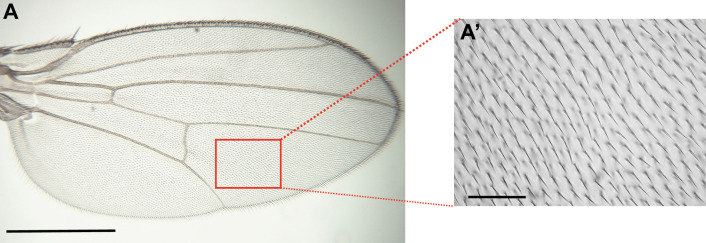
Figure 4—figure supplement 6. Illustration of wing trichome measurements.

Figure 4—figure supplement 6.

(A) Adult wings were dissected, mounted, and imaged using a ×4 objective. The box indicates the regions in which wing hairs/trichome were counted for each wing. Scale bar, 500 μm. (A’) Wing trichomes from the dorsal wing surface were imaged with a ×40 objective in the region between veins 4 and 5 just distal to the posterior crossvein (PCV). Trichomes were counted manually within the imaged area (37,500 µm2). Scale bar, 50 μm.