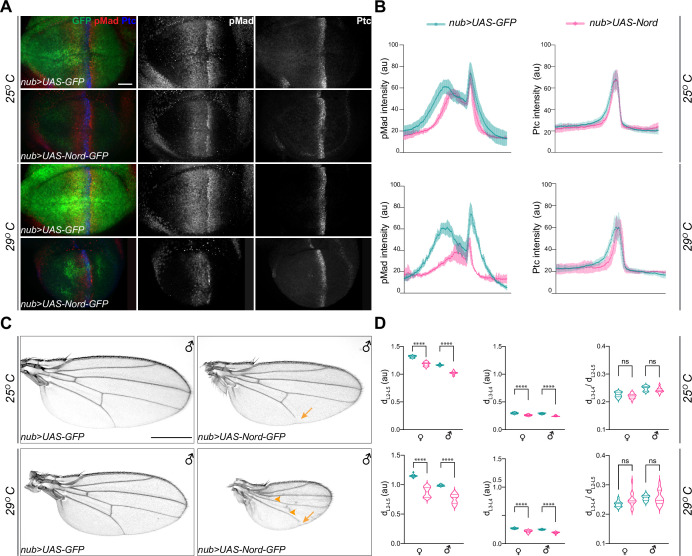
Figure 6. Ectopic expression of Nord attenuates Bone Morphogenetic Protein (BMP) signaling in vivo.
(A) Larvae expressing the indicated transgenes driven by nub-Gal4 were raised at 25 or 29°C. Wing imaginal discs were collected from these larvae in the late third instar stage, and then immunostained for anti-pMad (red), anti-Ptc (blue), and anti-GFP (green). Scale bar, 20 μm. (B) Plotted pixel intensity of pMad or Ptc as a function of anteroposterior (A/P) position. Each point shows the mean ± SD. 25°C: n = 12. 29°C: n = 7. (C) Adult wings from male flies, which expressed the indicated transgenes driven by nub-Gal4 and were raised at 25 and 29°C. Scale bar, 500 μm. Arrows indicate reduced L5, and arrowheads indicate reduced crossveins. (D) Quantification of distance between distal ends of longitudinal veins L2 and L5 (dL2–L5), L3 and L4 (dL3–L4), and the ratio of dL3–L4 /dL2–L5. Each bar shows the mean ± SD from n > 14 wings. au, arbitrary units. The unpaired two-tailed t-test was used for statistical analysis. ****p<0.0001, ns, not significant.


