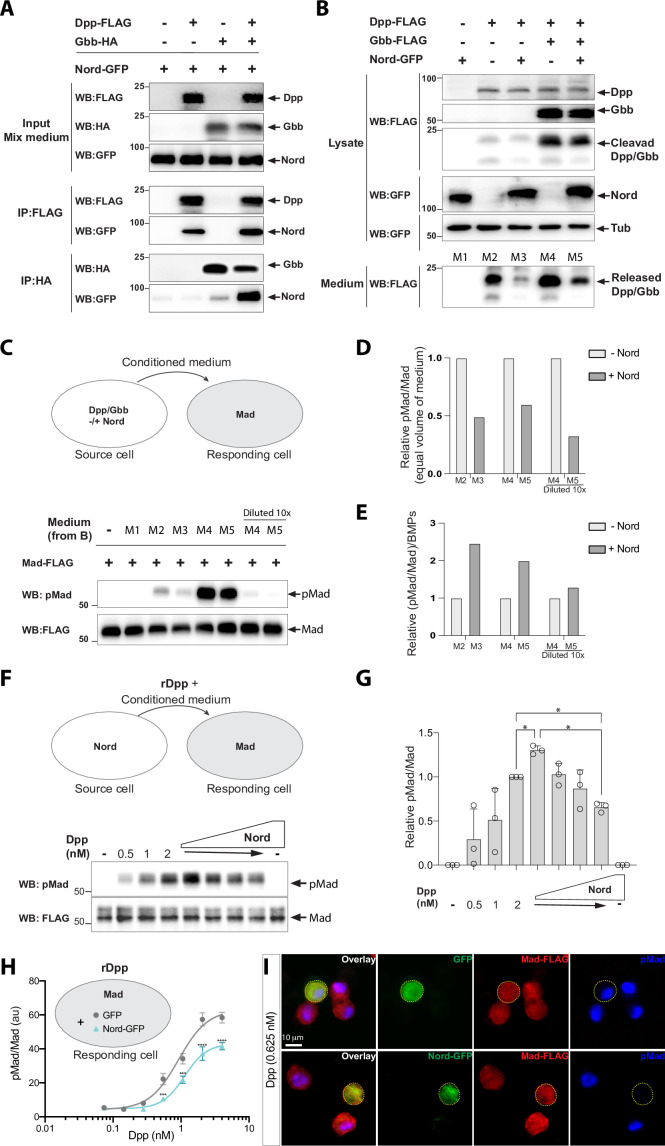
Figure 8. Nord binds to Decapentaplegic (Dpp) and attenuates Bone Morphogenetic Protein (BMP) signaling in vitro.
(A) Co-immunoprecipitation of Nord with the BMP ligands Dpp and Glass-bottom boat (Gbb). Medium from S2 cells transfected for expression of GFP-tagged Nord were mixed with medium from cells expressing FLAG-tagged Dpp and HA-tagged Gbb alone or in combination, followed by incubation with anti-FLAG or anti-HA antibody-coupled beads overnight at 4°C. Precipitated proteins were analyzed by Western blotting with indicated antibodies. Nord was immunoprecipitated with Dpp and, to a lesser extent, with Gbb. The amount of immunoprecipitated Nord was increased when Dpp and Gbb were co-transfected. (B) S2 cells were transfected for expression of FLAG-tagged Dpp or Gbb with or without GFP-tagged Nord (source cell). Both cell lysate and conditioned medium from the source cells were collected and followed by Western blot analysis. Loading was controlled by probing the blot for tubulin. The amount of Dpp or Dpp-Gbb ligands released into the medium was reduced when Nord was co-expressed in the source cells. (C) Comparison of BMP signaling activities of conditioned media in a cell-based signaling assay. After incubating the conditioned media collected in (B) with S2 cells stably expressing the FLAG-Mad transgene (Mad-S2, responding cell) for 1 hr at room temperature, the responding cells were washed and lysed. The lysates were probed with anti-pMad and anti-FLAG antibodies to detect both the phosphorylated Mad and total Mad protein, respectively. (D, E) Quantification of the Western blot data in panels (B) and (C). The levels of the secreted BMP ligands from the medium (anti-FLAG in panel B), phosphorylated Mad (anti-pMad in panel C), and total Mad (anti-FLAG in panel C) were measured based on the band intensity. The signaling activity from an equal volume of conditioned medium was determined by the ratio of pMad and the corresponding total Mad (pMad/Mad) in panel (C), which was then normalized to the condition without the exogenous Nord-GFP to calculate a relative signaling activity (D), or normalized to the secreted ligand amount to calculate the relative ligand activity ([pMad/Mad]/BMPs) (E). (F) Mad-S2 cells were treated with a recombinant Dpp peptide (rDpp) in the absence or presence of conditioned medium containing raising levels of Nord for 1 hr at room temperature, the responding cells were washed and lysed. The lysates were probed with anti-pMad and anti-FLAG antibodies to detect both the phosphorylated Mad and total Mad protein, respectively. (G) Quantification of the Western blot data in panel (F). The phosphorylated Mad (anti-pMad) and total Mad (anti-FLAG) levels were measured based on the band intensity. The signaling activity from each conditioned medium was determined by the ratio of pMad and the corresponding total Mad (pMad/Mad), which was then normalized to the condition with 2 nM Dpp but no additional Nord. Panel (F) is representative of n = 3 independent experiments. Each point shows the mean ± SD. One-way ANOVA test with Tukey’s multiple comparison was used for statistical analysis, and a significant difference was considered by *p<0.05. (H) Mad-S2 cells were transiently transfected for expression of GFP or Nord-GFP. 48 hr after transfection, the cells were treated with recombinant Dpp peptides for 1 hr. Upon treatment, the cells were washed, fixed, and stained by anti-FLAG to detect total Mad and anti-pMad to detect phosphorylated Mad. The average pMad levels were measured and normalized to the total Mad levels, and then plotted against different Dpp concentrations (0–5 nM). Each point shows the mean ± SD, n > 10. au, arbitrary units. The unpaired two-tailed t-test was used for statistical analysis. ***p<0.001, ****p<0.0001. (I) Representative images of Mad-S2 cells treated by 0.625 nM Dpp. Scale bar, 10 μm.

