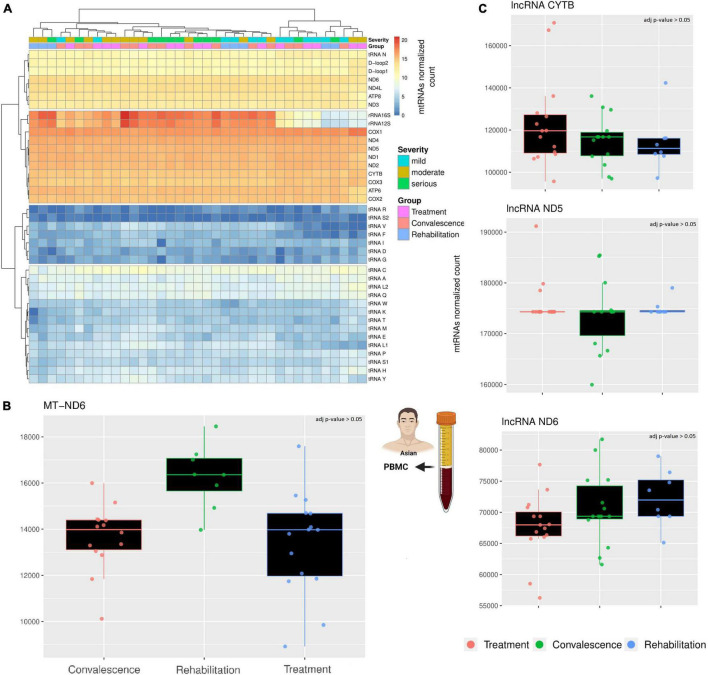
FIGURE 1.
A comparison across three clinical stages of long RNAs expression. (A) The heatmap compare the expression of canonical genes encoded on the mitochondrial genome. The rows represent mitochondrial genes, while the columns are individuals. Each individual has annotated the severity of the COVID-19 infection and the stage when their blood sample was taken. According to the different level of expression, ranging from blue to red, four clusters can be identified. Both columns and rows have been clustered. (B) The barplot compare the expression of MT-ND6 mRNA across three clinical stages. Each datapoint in a single clinical stage (e.g., Treatment) represent a different patient, furthermore, the patients are the same across the three clinical stages. (C) The barplots compare the expression of three lncRNAs across three clinical stages using the same criteria of the previous barplot. The icons in the figure highlights from which population and type of sample the data are generated. The icons have been made using Biorender.

