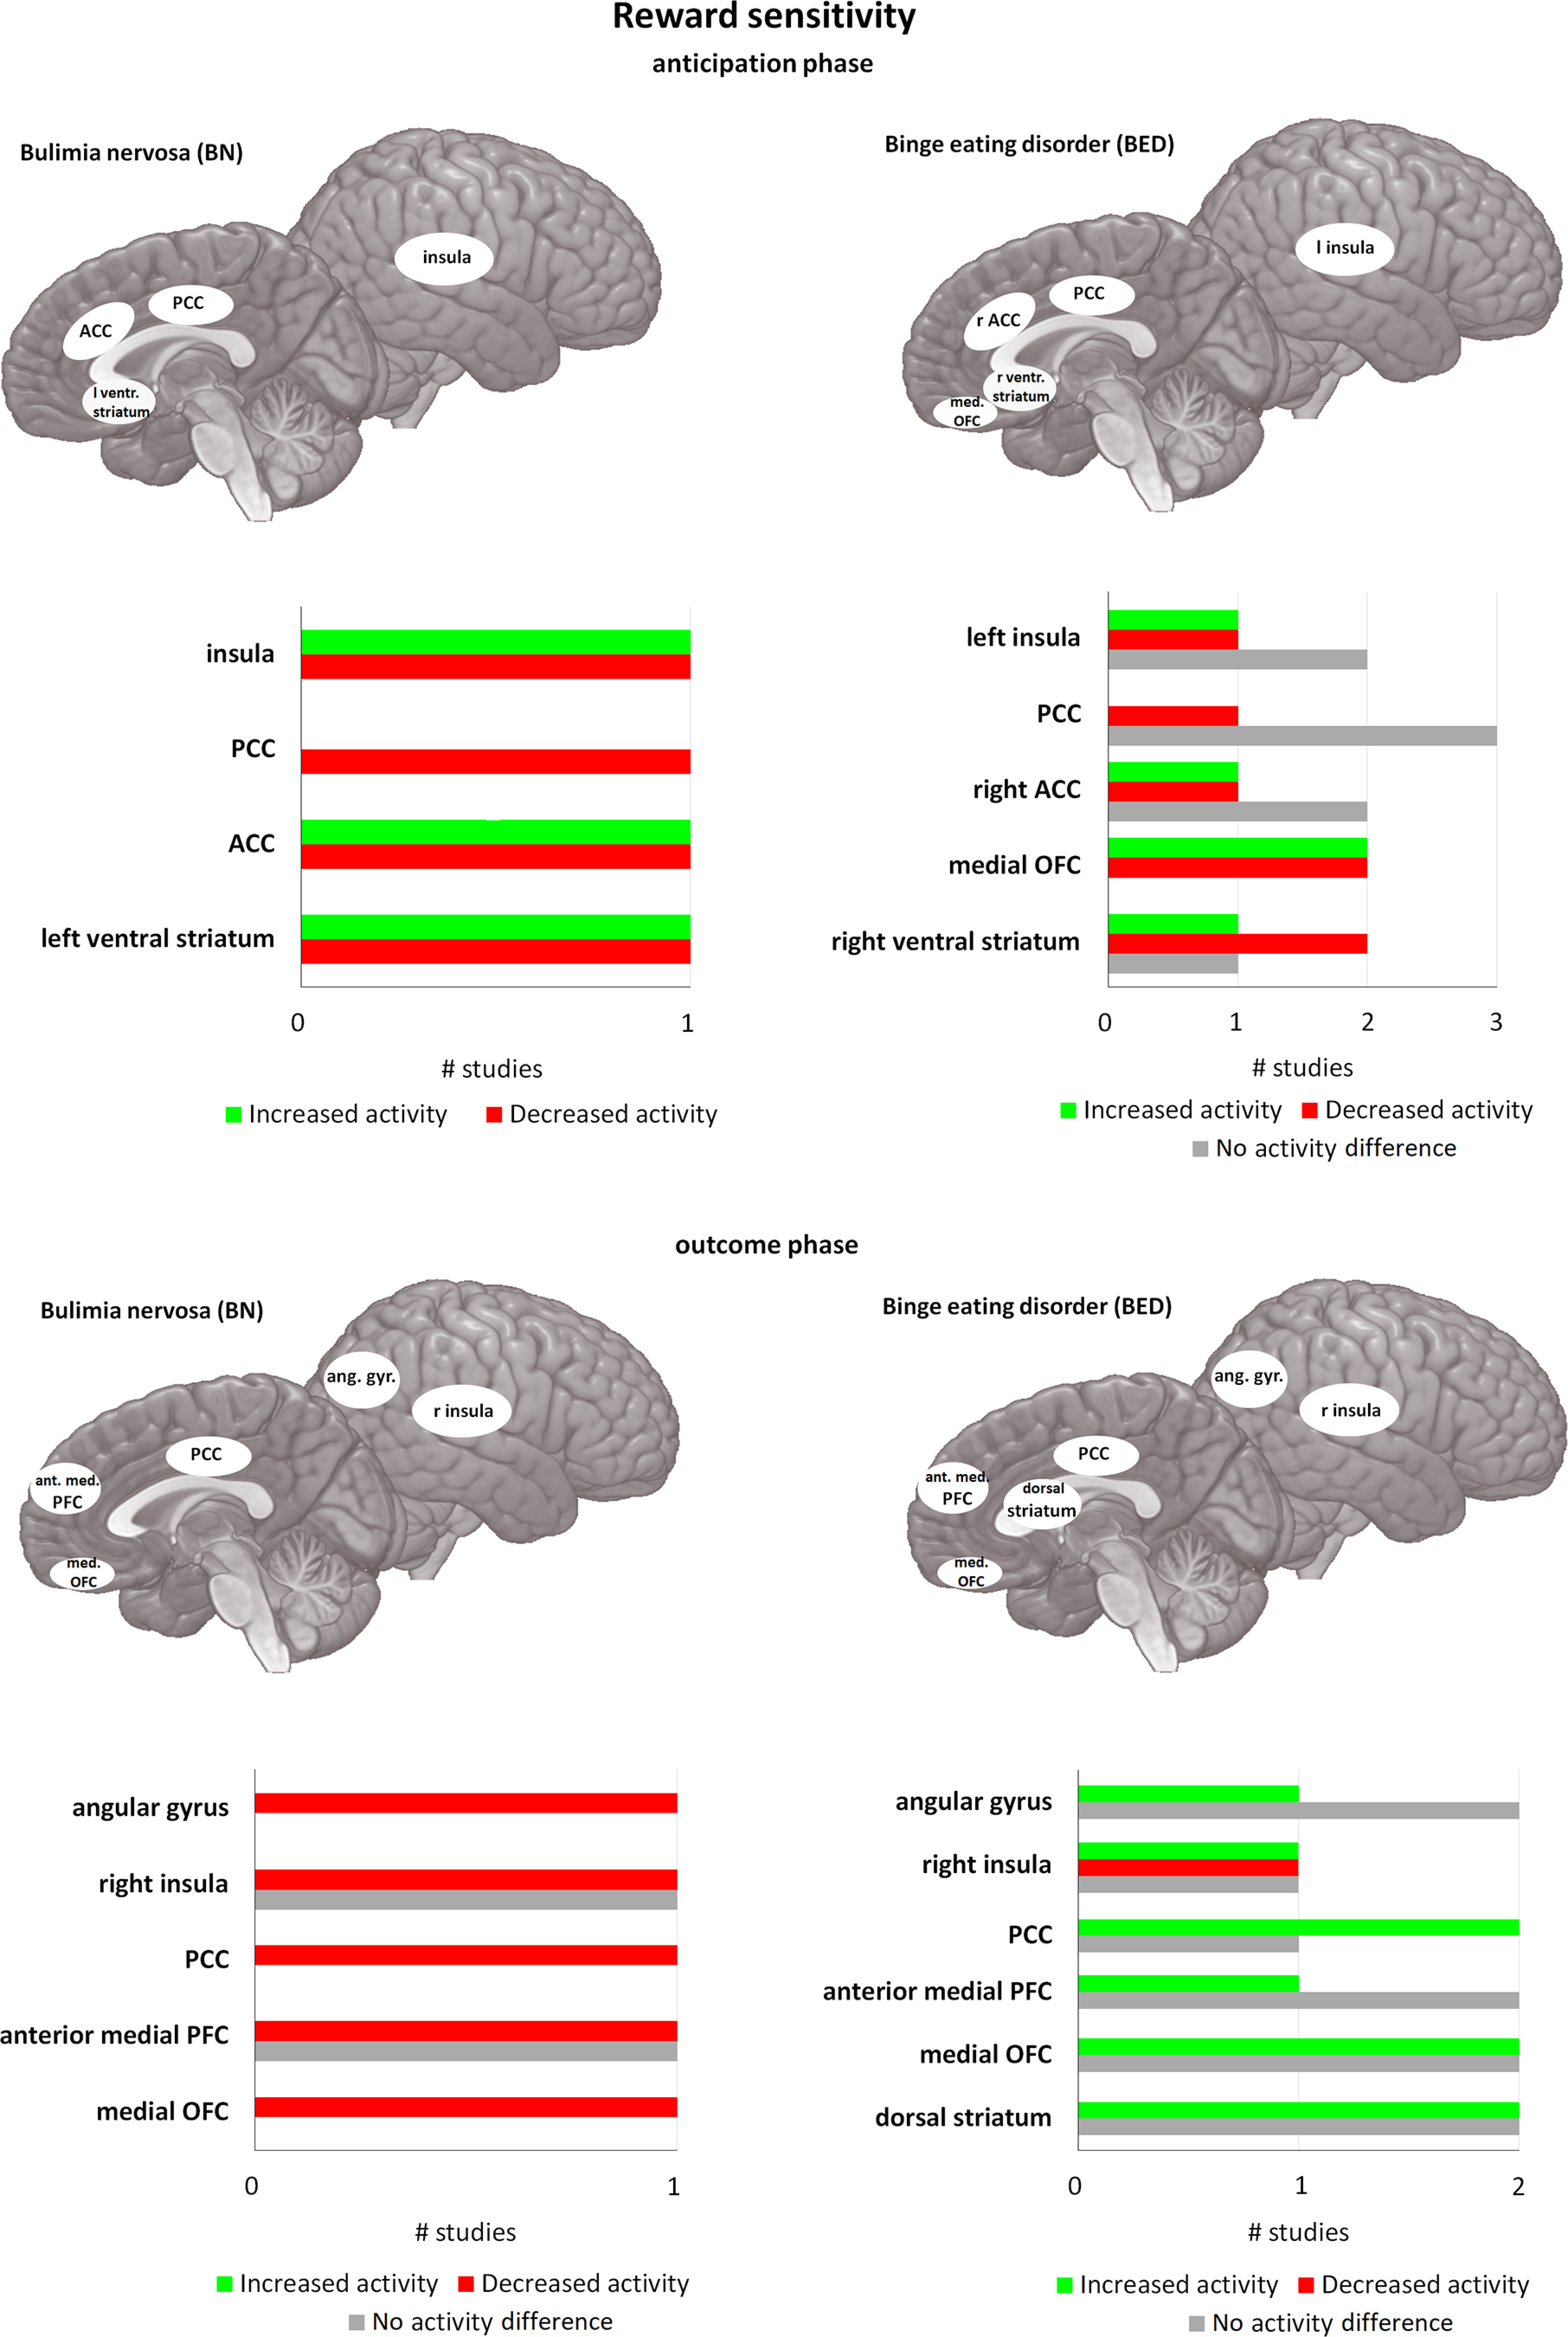
Figure 1.

Differences in activity in BN and BED in passive food viewing tasks and active food tasting tasks compared with matched controls. For each area, the bar graph indicates the number of studies that found a decrease in activity (= red), or an increase in activity (= green), and the studies that found no difference in activity (= gray), during passive food viewing tasks (i.e., studies using paradigms where participants had to merely view food stimuli; shown in the two images on top) and active food tasting tasks (i.e., studies where participants had to actively taste food in the scanner; represented in the two images at the bottom). All of the included studies found at least one brain area that was significantly different in activation in BN and/or BED compared with HC. PCC = posterior cingulate cortex, ACC = anterior cingulate cortex, ventr. striatum = ventral striatum, med. OFC = medial orbitofrontal cortex, ant. med. PFC = anterior medial prefrontal cortex, ang. gyr. angular gyrus. If no indication of lateralization is given (either left or right), differences are observed bilaterally.
