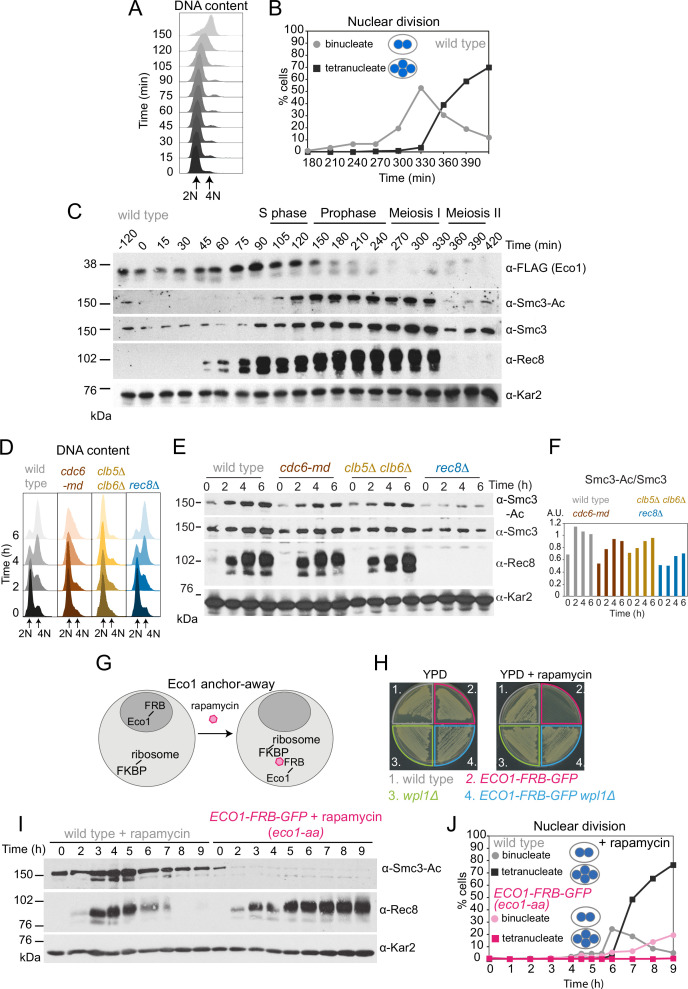
Figure 1. Eco1-dependent acetylation of Smc3-K112,113 occurs in meiotic S phase, independently of DNA replication.
(A–C) Smc3-Ac is deposited in S phase, following Eco1 production. Wild type (strain AM21574) carrying ECO1-6HIS-3FLAG and pCUP1-IME1 pCUP1-IME4 was released from a pre-meiotic S phase block 120 min after sporulation induction by addition of 25 μM CuSO4. (A) S phase completion (4N) was monitored by flow cytometry. (B) The percentages of bi- and tetranucleate cells were scored at the indicated timepoints to monitor meiosis I and II nuclear division, respectively (n = 200 cells per timepoint). (C) Western immunoblot shows the total cellular levels of Eco1-6HIS-3FLAG (α-FLAG), Smc3-Ac (α-Smc3-K112,113-Ac), Smc3 (α-Smc3), and Rec8 (α-Rec8) with Kar2 as a loading control (α-Kar2). (D, E) Bulk DNA replication is not essential for Smc3-Ac. Wild-type (AM11633), cdc6-md (AM28842), clb5Δ clb6Δ (AM28841), and rec8Δ (AM28843) cells carrying ndt80Δ were induced to sporulate and allowed to arrest in prophase I. (D) Flow cytometry shows DNA content. (E) Western immunoblot shows total cellular levels of Smc3-Ac (α-Smc3-K112,113-Ac), Smc3 (α-Smc3), Rec8 (α-Rec8), and Kar2 loading control (α-Kar2). (F) Quantification of Smc3-Ac normalized to Smc3 protein levels (A.U. = arbitrary units). (G) Schematic of the anchor-away system used to deplete Eco1 from the nucleus (eco1-aa). (H) The lethality of Eco1 anchor-away is rescued by deletion of WPL1. Haploid wild-type (AM13762), ECO1-FRB-GFP (AM22004), wpl1Δ (AM22440), and ECO1-FRB-GFP wpl1Δ (AM22981) strains of the anchor-away background (RPL13A-FKBP12, fpr1Δ, tor1-1) were plated on YPD or YPD + 1 μM rapamycin. (I, J) Eco1 is essential for meiotic progression. Anchoring-away Eco1-FRB-GFP reduces acetylation of Smc3-K112,K113, impairs cleavage of Rec8, and reduces nuclear divisions. Anchor-away wild-type (AM25532) and ECO1-FRB-GFP (AM22034) cells were induced to sporulate in the presence of 1 μM rapamycin. (I) Western immunoblot of whole-cell extracts showing Smc3-Ac (α-Smc3-K112,K113-Ac), Rec8 (α-Rec8), and Kar2 loading control (α-Kar2). (J) The percentages of bi- and tetranucleate cells were scored after DAPI staining at the indicated timepoints (n = 200 cells/timepoint).


