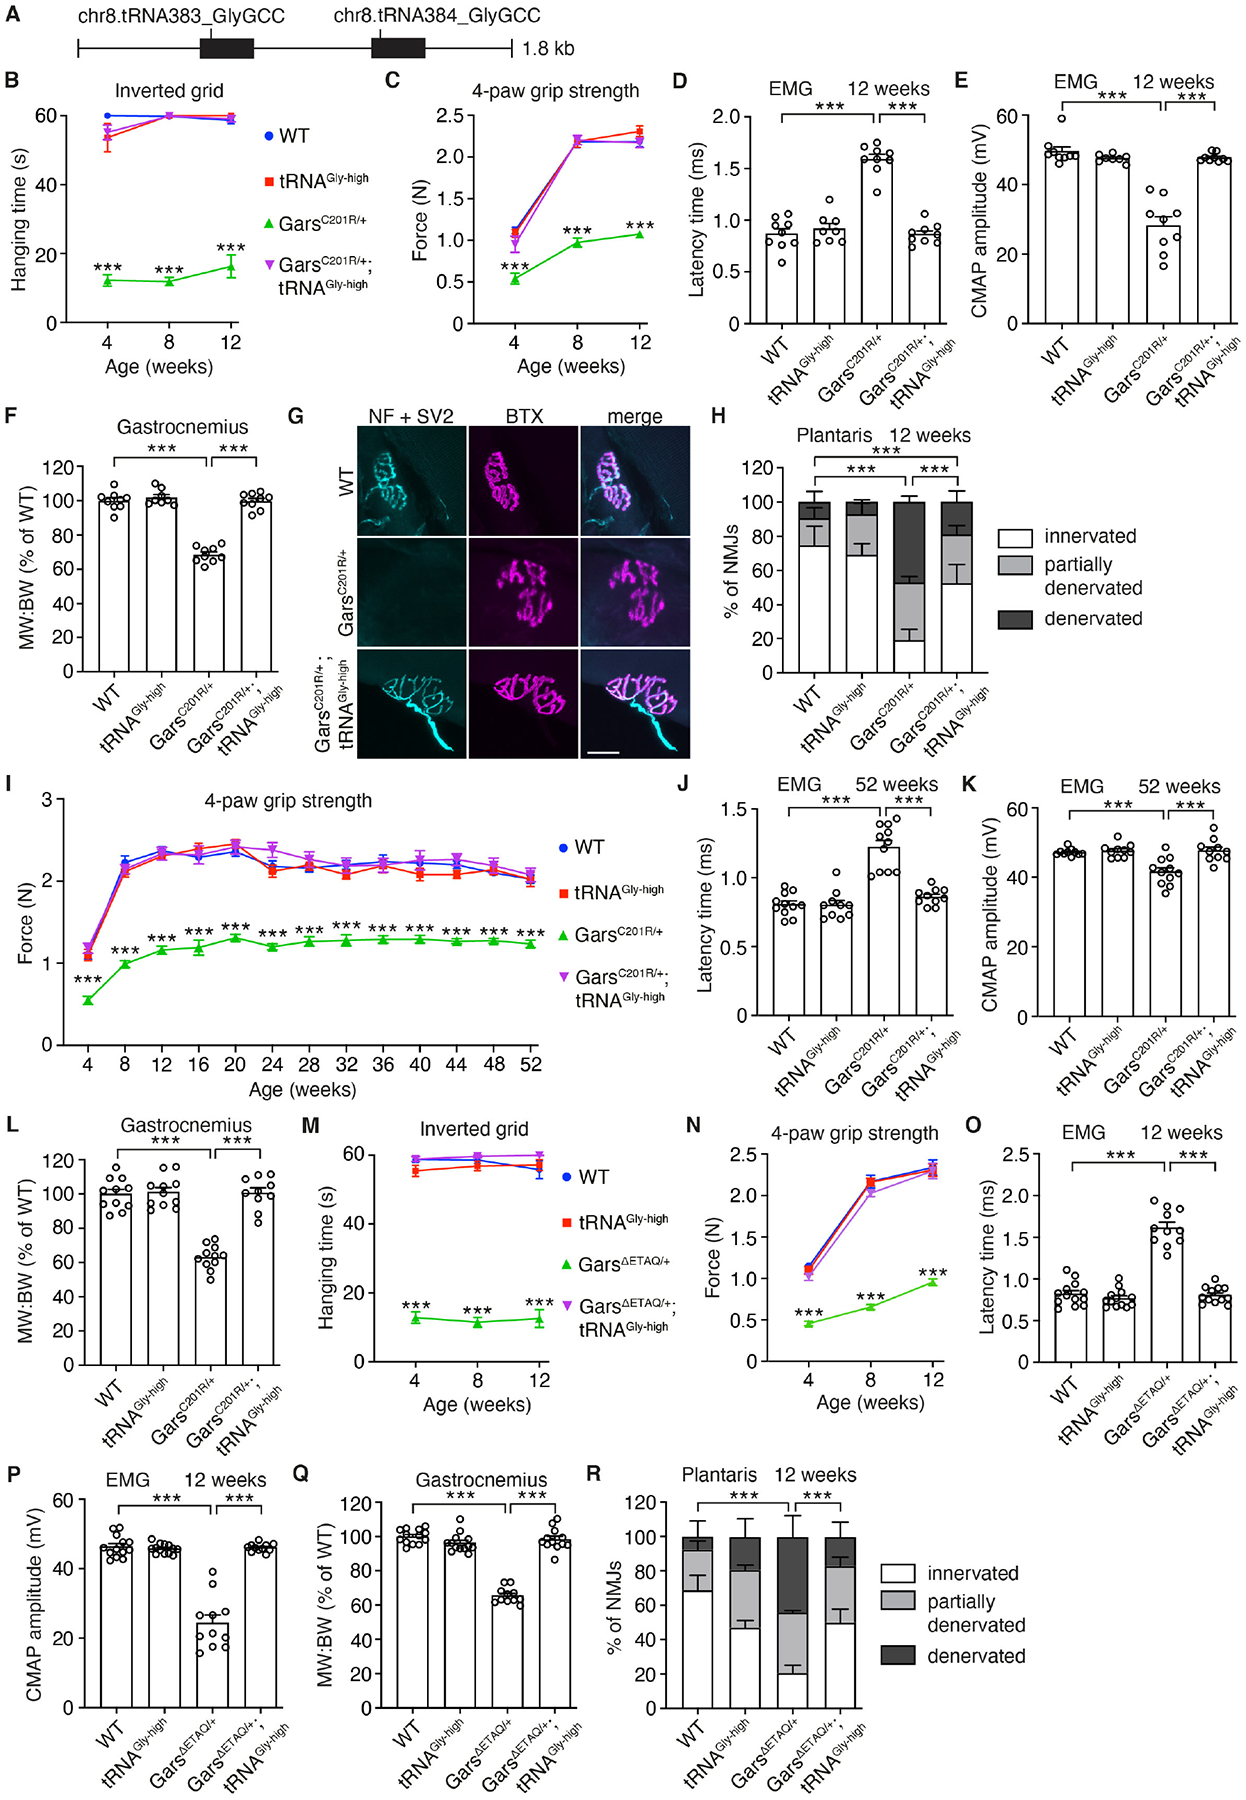
Fig. 2. tRNAGly-GCC overexpression rescues peripheral neuropathy in CMT2D mouse models.

(A) Schematic of the genomic fragment used for generation of tRNAGly-GCC transgenic mice. (B,M) Hanging time in the inverted grid test of male GarsC201R/+ x tRNAGly-high (B) or GarsΔETAQ/+ x tRNAGly-high (M) mice. n=8–9 (B), 11–13 (M) mice per genotype; ***p<0.0001 by one-sample t-test and two-tailed unpaired t-test with Bonferroni correction per time point. (C,I,N) 4-paw grip strength as measured by dynamometer. n=8–9 (C), 10–11 (I), 11–13 (N) mice per genotype; ***p<0.001 by two-way ANOVA with Tukey’s multiple comparisons test per time point (C,I) or Brown-Forsythe and Welch ANOVA (N). (D,E,J,K,O,P) Electromyography (EMG) at 12 (D,E,O,P) or 52 (J,K) weeks of age. (D,J,O) Latency time between sciatic nerve stimulation at sciatic notch level and detection of a compound muscle action potential (CMAP) in the gastrocnemius muscle. n=8–9 (D), 10–11 (J), 11–13 (O) mice per genotype; ***p<0.0001 by two-way ANOVA with Tukey’s multiple comparisons test (D) or Brown-Forsythe and Welch ANOVA (J,O). (E,K,P) CMAP amplitude in the gastrocnemius muscle. n=8–9 (E), 10–11 (K), 11–13 (P) mice per genotype; ***p<0.0005 by Brown-Forsythe and Welch ANOVA (E,P) or two-way ANOVA with Tukey’s multiple comparisons test (K). (F,L,Q) Ratio of muscle weight to body weight (MW:BW, shown as % of WT) of the gastrocnemius at 12 (F,Q) or 52 (L) weeks of age. n=8–9 (F), 10–11 (L), 11–13 (Q) mice per genotype; ***p<0.0001 by two-way ANOVA with Tukey’s multiple comparisons test. (G,H,R) Representative images (G) and quantification (H,R) of NMJ innervation status in plantaris muscle. In (G), neurofilament (NF) and SV2 label presynaptic nerve endings, while TRITC-conjugated bungarotoxin (BTX) labels postsynaptic acetylcholine receptors. n=5 mice per genotype; ***p<0.005 by Fisher’s Exact test with Bonferroni correction. Scale bar: 25μm. Graphs represent mean ± SEM.
