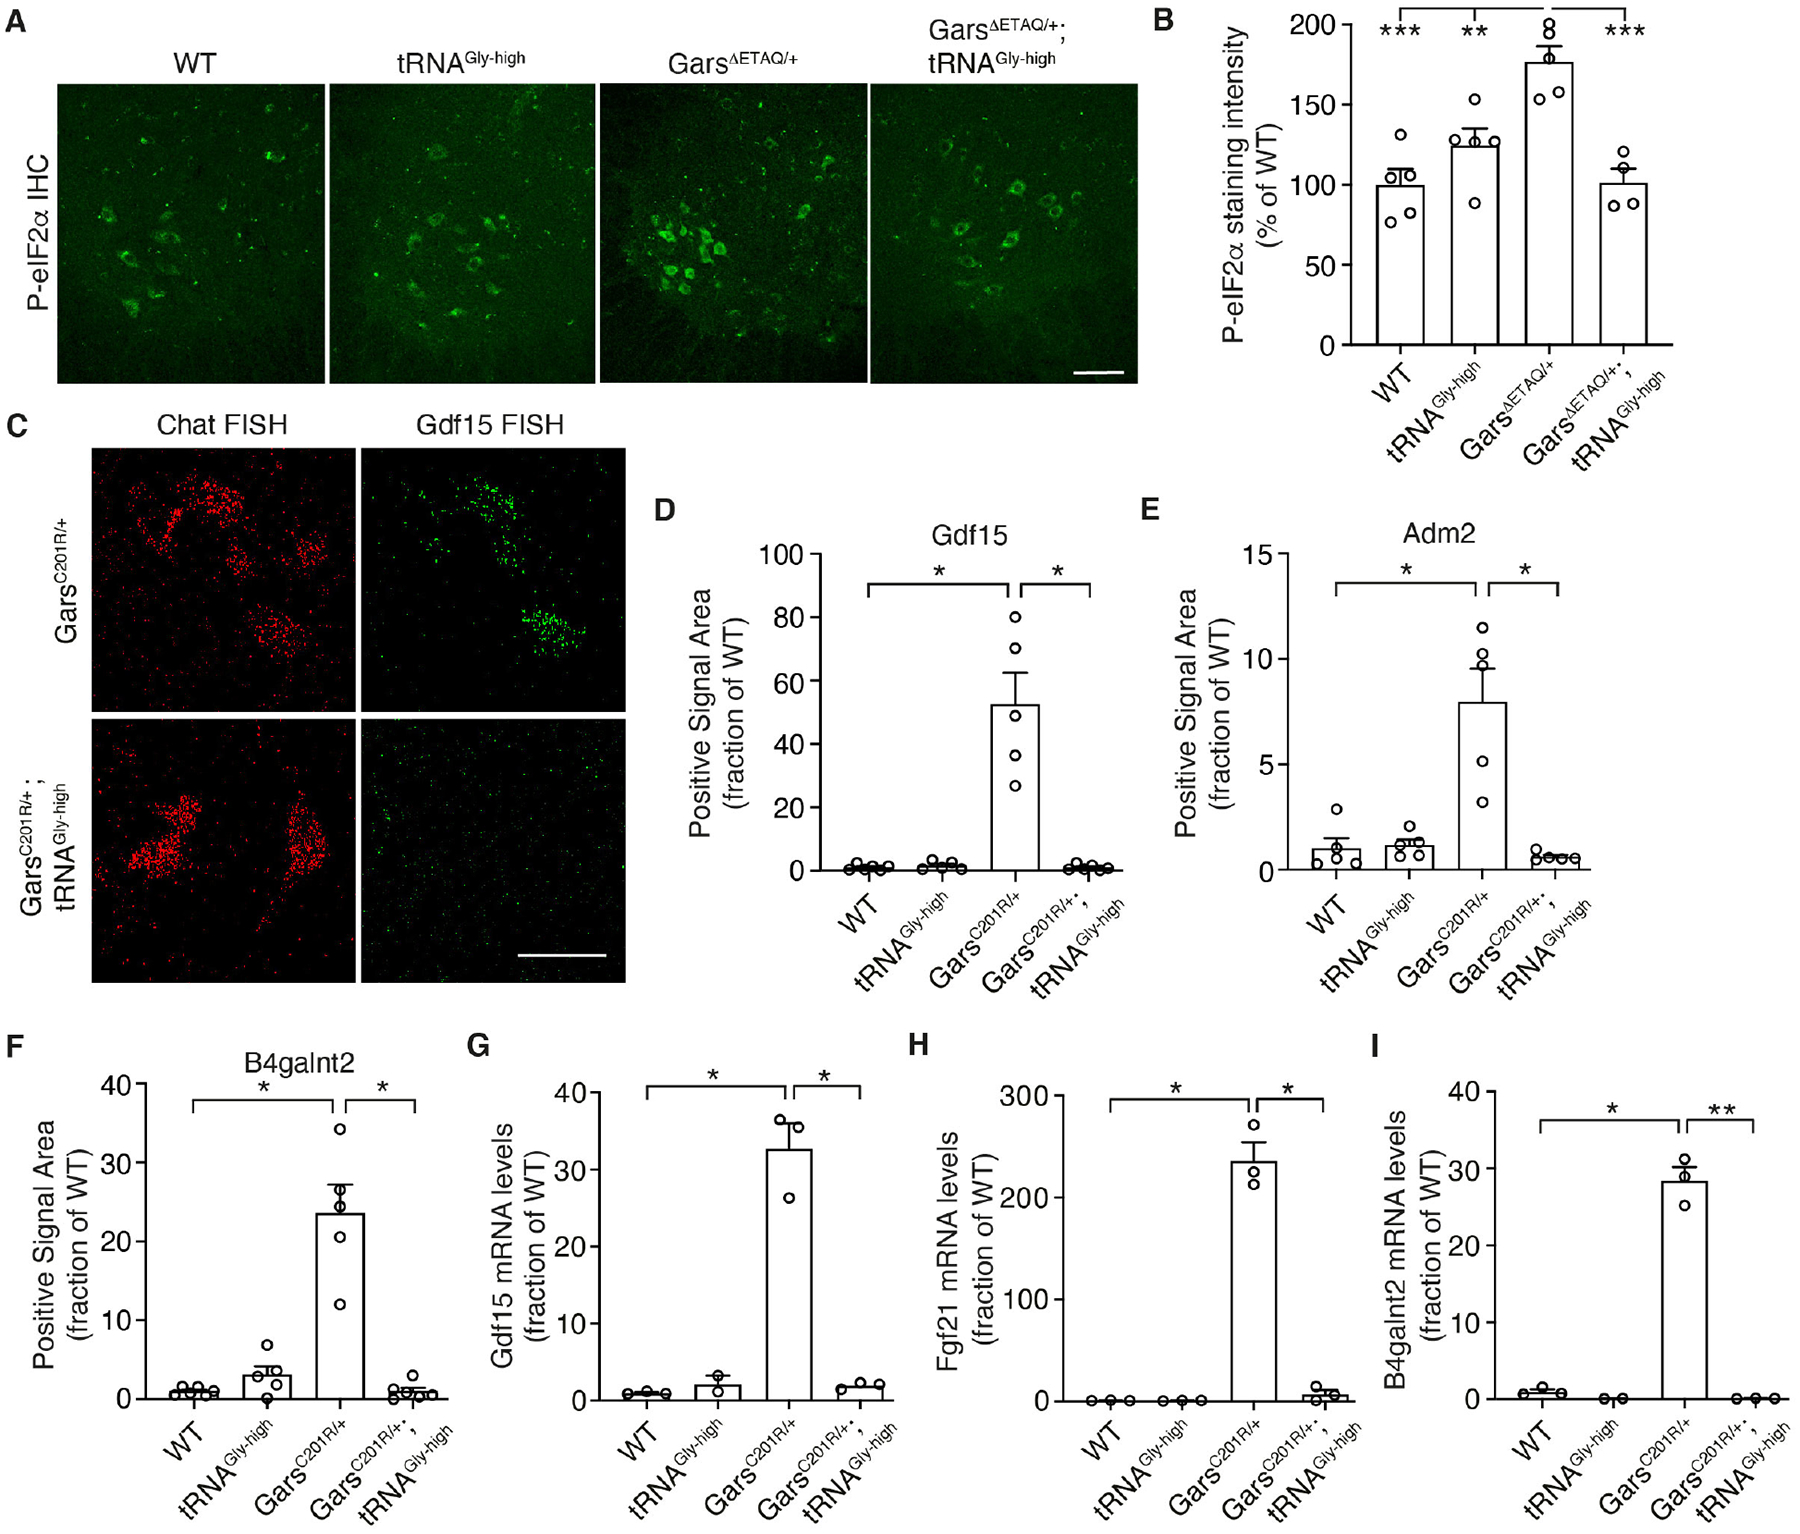
Fig. 4. tRNAGly-GCC overexpression prevents ISR activation in CMT2D mouse models.

(A,B) Representative images (A) and quantification (B) of immunostaining intensity of phosphorylated eIF2α in motor neuron cell bodies in the spinal cord ventral horn of GarsΔETAQ/+ x tRNAGly-high mice. Scale bar: 100μm. n=4–5 mice per genotype; **p<0.01, ***p<0.0005 by two-way ANOVA with Tukey’s multiple comparisons test. (C-F) Representative images (C) and quantification of fluorescent in situ hybridization (FISH) for ATF4 target genes Gdf15 (D), Adm2 (E), and B4galnt2 (F). Scale bar: 50μm. n=5–6 mice per genotype; *p<0.05 by two-tailed Welch’s t-test with Bonferroni correction. (G-I) mRNA levels of ATF4 target genes Gdf15 (G), Fgf21 (H) and B4galnt2 (I) in spinal cord of GarsC201R/+ x tRNAGly-high mice. n=3 per genotype; *p<0.05, **p<0.01 by Brown-Forsythe and Welch ANOVA. Graphs represent mean ± SEM.
