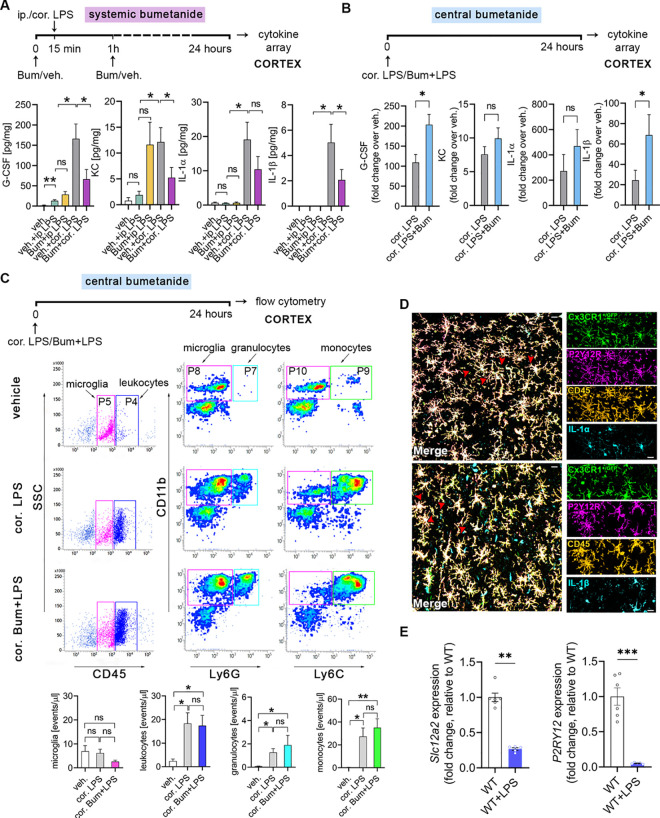
Fig 1. Systemic and central (intracortical) blockade of NKCC1 regulate LPS-induced inflammatory cytokine production in the brain in an opposite manner.
(A) Mice were subjected to either ip. or cor. LPS injections, while NKCC1 was blocked by ip. Bum administration. Central LPS injection triggers high cytokine (G-CSF, IL-1α, IL-1β) and KC responses in the brain compared to ip. LPS injection, which is blocked by ip. Bum administration. (B) Central NKCC1 inhibition by cor. Bum administration significantly increases G-CSF and IL-1β levels. See also S1 Fig for effects of systemic vs. central blockade of NKCC1 on LPS-induced cytokine responses in the periphery. (C) Flow cytometric dot plots show that cortical administration of Bum does not affect the number of microglia (CD45int/P5 gate), and recruitment of leukocytes (CD45high/P4 gate), including monocytes (CD11b+, Ly6Chigh /P9 gate), and granulocytes (CD11b+, Ly6Ghigh/P7 gate) upon central LPS injection. (D) The main source of IL-1α and IL-1β in the brain are microglia cells. Confocal images of Cx3CR1+/GFP brain slices show IL-1α-CD45-P2Y12R (above, red arrowheads) and IL-1β-CD45-P2Y12R (below, red arrowheads) labeled cells after cortical LPS injection-induced inflammation. (E) NKCC1 (encoded by Slc12a2) and P2Y12R gene expression is down-regulated in microglia isolated from adult mice 24 hours after cisterna magna LPS application. (A) Kruskall–Wallis followed by Dunn’s multiple comparison test; *p < 0.05; N (veh.) = 5, N (veh. + ip. LPS) = 5, N (Bum + ip. LPS) = 5, N (veh. + cor. LPS) = 5, N (Bum + cor. LPS) = 9. (B) Unpaired t test; *p < 0.05; N = 9/group; data were pooled from two independent studies. (C) One-way ANOVA followed by Tukey’s multiple comparison test; *p < 0.05; N (veh.) = 5, N (cor. LPS) = 6, N (cor. Bum + LPS) = 6. (D) Scale: 25 μm. (E) Unpaired t test; **p < 0.01, ***p < 0.001; N (WT) = 6, N (WT + LPS) = 5. Data underlying this figure can be found in S1 Data. Bum, bumetanide; cor., cortical; ip., intraperitoneal; ns, not significant; veh., vehicle; WT, wild type.

