
Fig 2. Deletion of microglial NKCC1 markedly impacts on baseline cell morphology and alters transformation to reactive microglia.
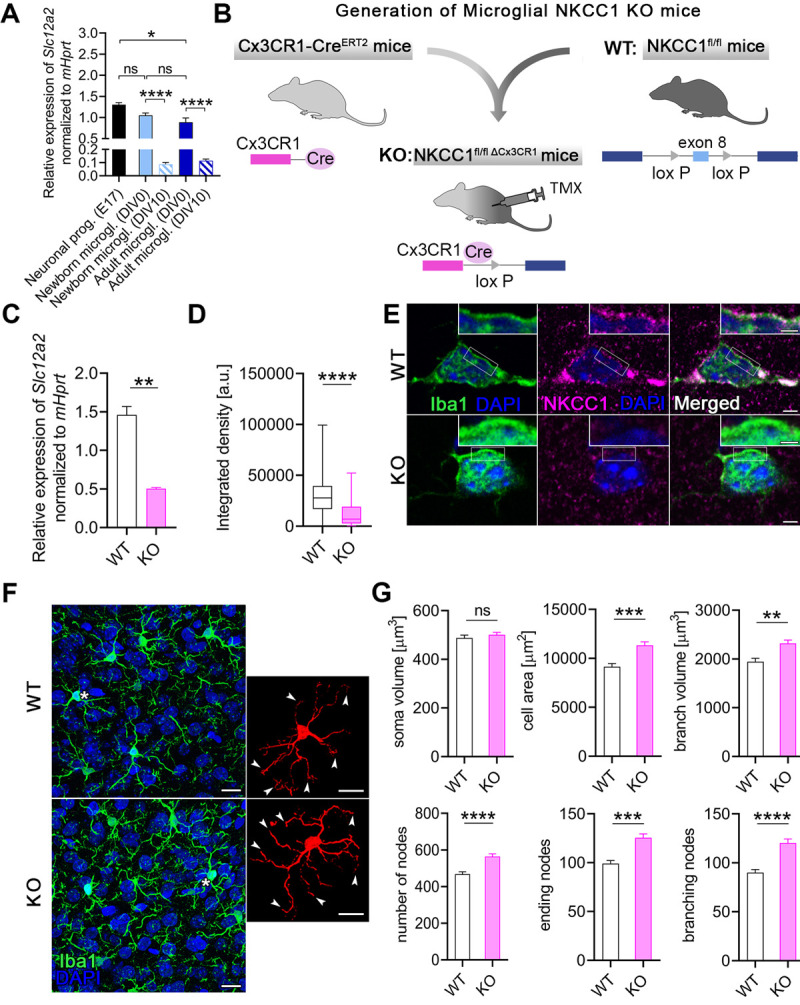
(A) NKCC1 mRNA expression levels in newborn and adult microglia isolated from C57BL/6J mice compared to neural progenitors derived from E17 embryonic hippocampi. Note that NKCC1 mRNA levels decrease dramatically during in vitro maintenance (DIV10). (B) We generated a novel microglia-specific conditional NKCC1 KO transgenic mouse line by crossing NKCC1fl/fl (exon 8 of the Slc12a2 gene was flanked with lox P sites) and Cx3CR1-CreERT2 mice. (C) NKCC1 mRNA levels in isolated NKCC1 KO microglia was markedly reduced in comparison to WT cells. (D, E) NKCC1 protein expression in a large number of randomly sampled NKCC1 KO microglia cells is markedly reduced compared to WT cells. Inserts show plasma membrane localization of NKCC1. (F, G) Automated morphological analysis and maximum intensity projections of confocal images. Inserts show cells marked with white asterisks in 3D. Arrowheads indicate altered branch structure of NKCC1 KO microglia. Automated morphological analysis shows that features of NKCC1-deficient microglia significantly differ from WT microglia. (A) One-way ANOVA, followed by Holm–Sidak’s post hoc test. N (Neuronal progenitor) = 3, N (Newborn microglia DIV0) = 6, N (Newborn microglia DIV10) = 5, N (Adult microglia DIV0) = 7, N (Adult microglia DIV10) = 6. **: p < 0.01. (C) Unpaired t test, N = 3/group. **: p < 0.01. (D) Mann–Whitney test, N (WT) = 142 cells from 2 mice, N (KO) = 83 cells from 1 mouse. ****: p < 0.0001. (E) Scale: 2 μm, in inserts: 1 μm. (F, G) Scale: 25 μm; Mann–Whitney test, N (WT) = 162 cells from 3 mice, N (KO) = 281 cells from 5 mice. **: p < 0.01, ***: p < 0.001, ****: p < 0.0001. Data underlying this figure can be found in S1 Data. DIV, days in vitro; E17; embryonic day 17 KO, knockout; ns, not significant; TMX, tamoxifen; WT, wild type.