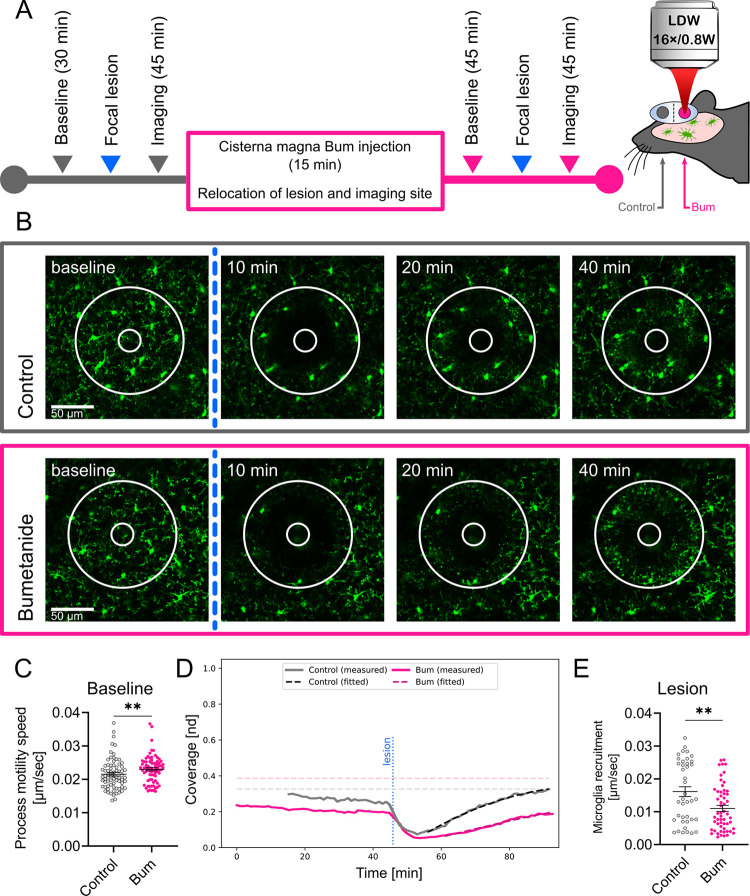
Fig 3. Microglial process dynamics and injury-induced process recruitment are altered by bumetanide.
(A) Outline of the 2-photon imaging experiment performed in Cx3CR1+/GFP (microglia reporter) mice. Imaging was performed to assess baseline microglial process motility and response to laser-induced injury followed by Bum administration into the cisterna magna and identical measurements at a different, undisturbed cortical region. (B) Representative images of microglial responses at selected time points, taken from S1 Video. The lesion site is marked with a circle that completely covers the area of the lesion. The ablation zone (i.e., the inner circle) was excluded from the analysis (see Materials and methods). (C) Mean base-state velocity distribution of processes from manual image tracking. Data show a 7% higher mean velocity of cell processes after Bum administration. (D) Evaluation of microglial process coverage over time in the lesion-centered circular area generated by a custom image analysis pipeline. Solid lines show the proportion of the area covered by microglial GFP signal. Dashed curves show the calculated values of coverage from the best-fitting curves. Horizontal lines are the predicted maximal coverage values for the lesion site; vertical line is the time point of the lesioning. (E) Calculated postlesion velocities of microglial process recruitment using automated image analysis followed by model fitting. Data show a significant decrease (31.7%) in mean frontline velocity of cells with Bum administration. (B) Scale: 50 μm. (C) Mann–Whitney test, NControl = 73, NBum = 76 processes from 5 mice, **: p < 0.01. (E) Mann–Whitney test, NControl = 40, NBum = 56 fitted values from 5 and 7 mice, respectively, **: p < 0.01. Data underlying this figure can be found in S1 Data. Bum, bumetanide.

