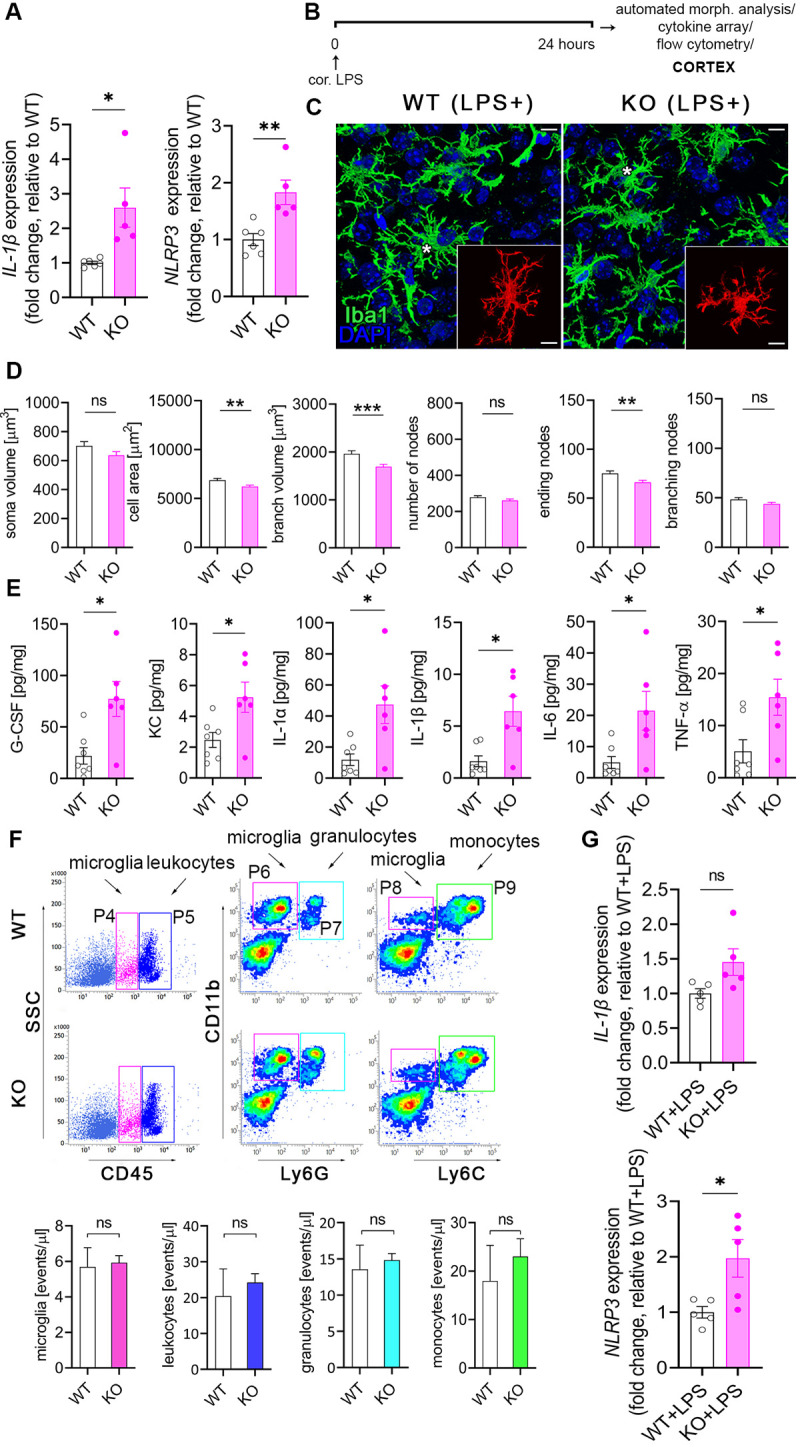
Fig 4. The absence of microglial NKCC1 boosts inflammatory cytokine production in the cerebral cortex in response to an inflammatory stimulus.

(A) Baseline NLRP3 and IL-1β mRNA expression is increased in isolated NKCC1 KO microglia compared to WT cells. (B) Experimental outline of automated morphological analysis, cytokine array, and flow cytometry. (C, D) Automated morphological analysis shows that activated NKCC1-deficient microglia are slightly smaller than their WT counterparts. (E) LPS-induced cytokine levels are significantly higher in the cortices of microglial NKCC1 KO mice than in WT. (F) Flow cytometric dot plots show that microglial NKCC1 deficiency does not alter the number of CD11b+, CD45int microglia (P4 gate) or numbers of infiltrating CD11b+, CD45high leukocytes (P5 gate), CD11b+, Ly6Chigh monocytes (P9 gate) and CD11b+, Ly6Ghigh granulocytes (P7 gate) in response to intracortical LPS administration. See corresponding data on peripheral cytokine levels and immune cell populations in S3 Fig. (G) Increased NLRP3 and IL-1β mRNA levels are sustained in NKCC1 KO and WT microglia 24 hours after intracisternal LPS administration. (A) Unpaired t test; *p < 0.05, **p < 0.01; N (WT) = 6, N (KO) = 5. (C) Scale: 25 μm. (D) Mann–Whitney test, N (WT) = 108 cells from 6 mice, N (KO) = 92 cells from 4 mice, **p < 0.01, ***p < 0.001. (E) Unpaired t test, *: p < 0.05; N (WT) = 7, N (KO) = 6. (F) Unpaired t test, N (WT) = 4, N (KO) = 4. (G) Unpaired t test; *p < 0.05; N (WT + LPS) = 5, N (KO + LPS) = 5. Data underlying this figure can be found in S1 Data. KO, knockout; ns, not significant; WT, wild type.
