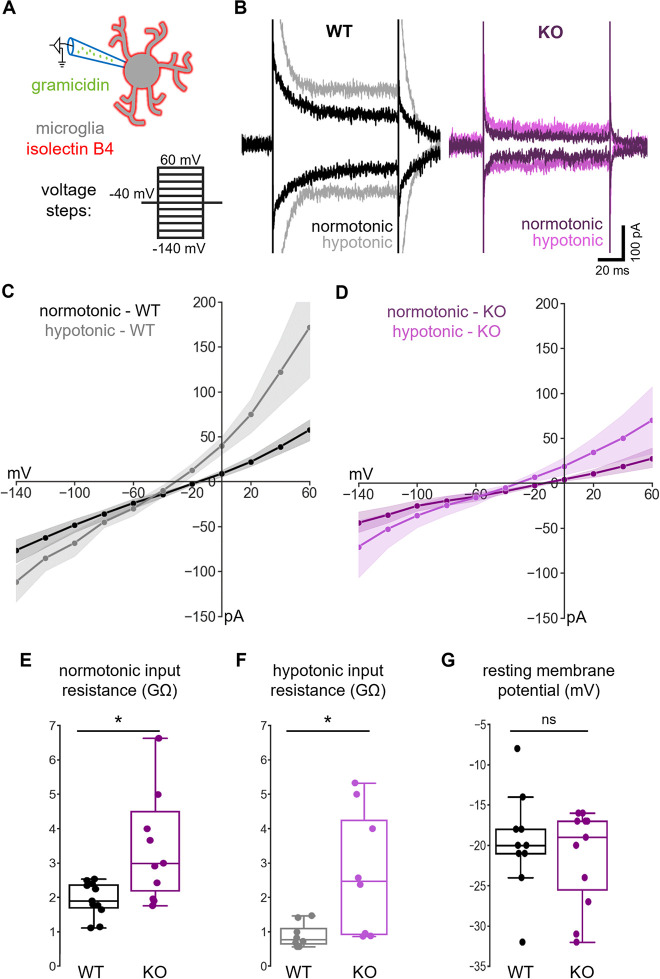
Fig 5. Deletion of NKCC1 from microglia results in altered membrane currents.
(A) Schematic representation of the experiment. Perforated patch-clamp recordings were performed on isolectin B4–labeled microglial cells in acute hippocampal slice preparations. Current responses to a train of voltage steps from −140 to 60 mV with 20 mV increments and a duration of 100 ms were measured in voltage-clamp mode (holding potential: −40 mV) both in normotonic, and after 5-minute perfusion with hypotonic ACSF (50% dilution). (B) Example traces of recordings from WT (black: normotonic, gray: hypotonic ACSF) and NKCC1 KO (purple: normotonic, violet: hypotonic ACSF) animal. Traces show responses at −140 and +60 mV voltage steps in both conditions. (C) Average I-V curve responses from WT in normotonic (N = 11 cells, black with SEM) and in hypotonic (N = 8 cells, gray with SEM) condition. (D) Average I-V curves from NKCC1 KO in normotonic (N = 11 cells, purple with SEM) and in hypotonic (N = 8 cells, violet with SEM) condition. (E) Input resistance of WT versus KO cells in normotonic condition. (F) Input resistance of WT versus KO cells in hypotonic condition. (G) Resting membrane potential in normotonic condition of WT versus NKCC1 KO microglial cells measured in current-clamp mode (0 pA injected current). (E) Mann–Whitney; N (WT) = 11 cells from 8 animals, N (KO) = 11 cells from 7 animals; *: p < 0.05. (F) Mann–Whitney; N (WT) = 8 cells from 6 animals, N (KO) = 8 cells from 5 animals; *: p < 0.05. (G) Mann–Whitney; N (WT) = 10 cells from 8 animals, N (KO) = 11 cells from 7 animals. Data underlying this figure can be found in S1 Data. KO, knockout; ns, not significant; WT, wild type.

