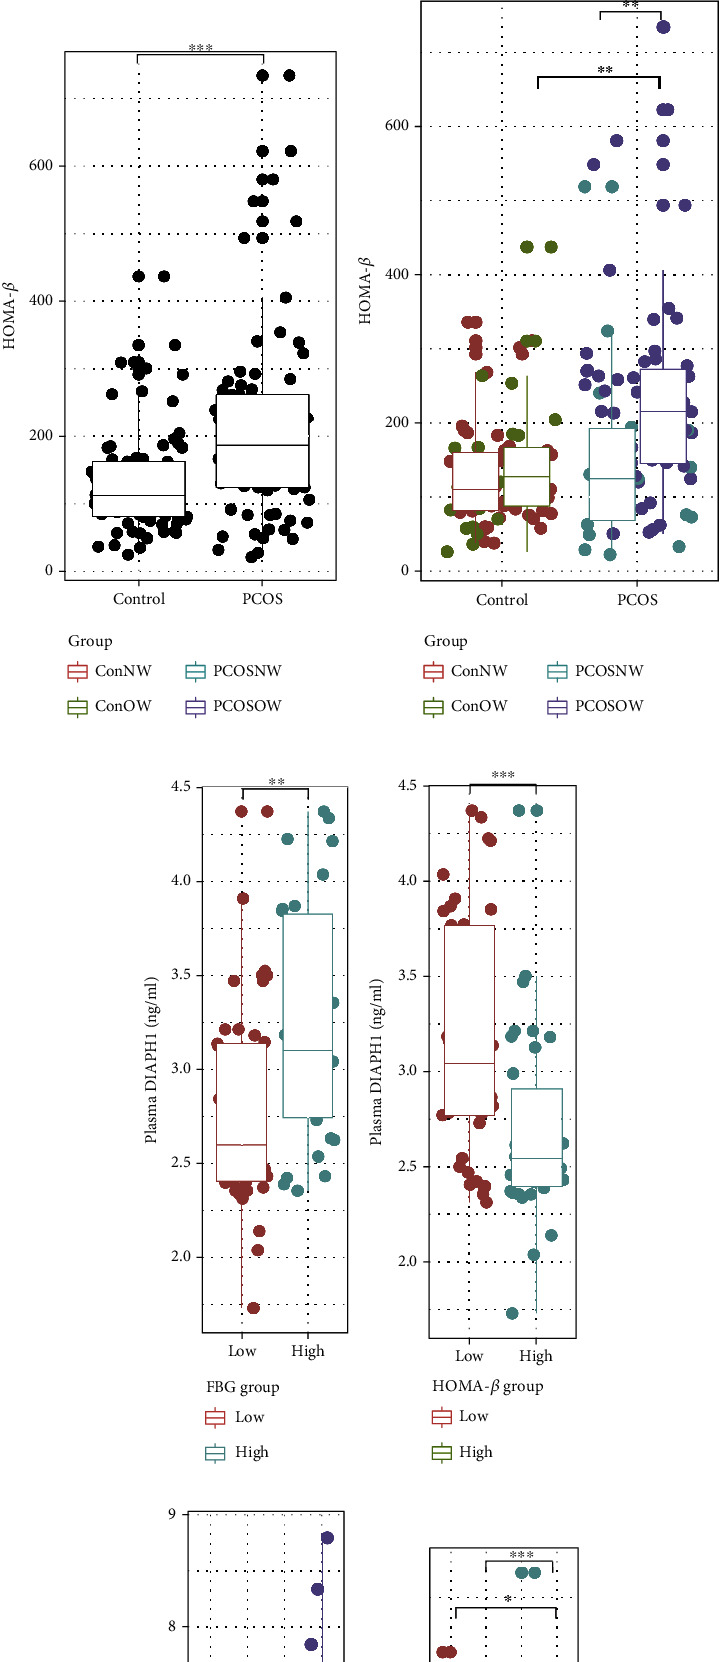
Figure 2.

FBG and HOMA-β levels in the PCOS and control groups and DIAPH1 quantile groups. (a) FBG levels in the control and PCOS group. (b) FBG levels in the normal-weight (NW) and overweight/obese (OW) subgroups of the control and PCOS groups. (c) HOMA-β levels in the control and PCOS group. (d) HOMA-β levels in the normal-weight (NW) and overweight/obese (OW) subgroups of the control and PCOS groups. (e) DIAPH1 levels by FBG in the PCOS group: FBG < 5 represented a relatively low level of FBG, and FBG > 5 represented a relatively high level of FBG. (f) DIAPH1 levels by HOMA-β in the PCOS group: HOMA − β < 200 represented a relatively low level of HOMA-β, and HOMA − β > 200 represented a relatively high level of HOMA-β. (g) FBG levels by DIAPH1 quartiles in the PCOS group. (h) HOMA-β levels by DIAPH1 quartiles in the PCOS group. Data are presented as interquartile ranges (25–75%). The Mann–Whitney U test was performed to compare variables between the two groups. The Kruskal-Wallis test followed by pairwise comparisons using the BWS all-pairs test was performed for the four subgroups. ∗P < 0.05, ∗∗P < 0.01, ∗∗∗P < 0.001.
