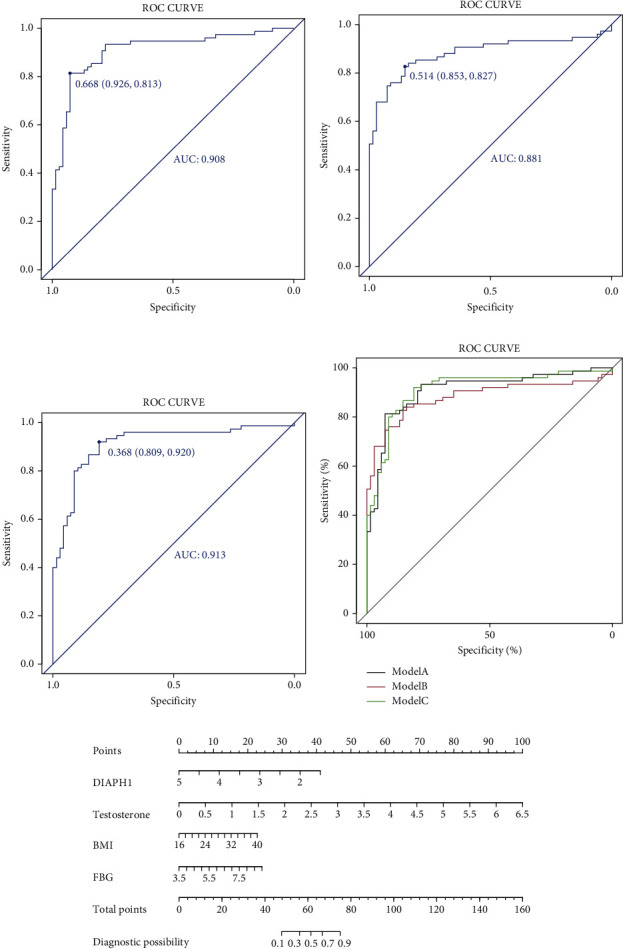
Figure 3.

The diagnosis of PCOS using clinical indicators and plasma DIAPH1. (a)–(c) The ROC curves in 3 different models. (a) Model A: BMI + HOMA − β + testosterone + DIAPH1; (b) model B: BMI + FBG + LH/FSH + DIAPH1; (c): model C: BMI + FBG + testosterone + DIAPH1. (d) The combination of ROC curves in 3 models. (e) The logistic regression-based nomogram is based on variables in model C. Instructions: according to patient values at each axis, vertical lines could be drawn to the point axis to determine the score/point for each variable. The vertical lines of the calculated total points line referred to the diagnostic possibility of PCOS. Example: during the child-bearing period, the woman had a BMI of 26 kg/m2 and a plasma DIAPH1 level of 2.5 mg/mL, FBG level of 7 mmol/L, and testosterone level of 1.0 nmol/L; the points for the DIAPH1 points were 30, BMI was approximately 10, FBG points were 15, and testosterone points were 23. The total points are summed as 88, and the possibility of having PCOS is approximately 88%. ROC curve: receiver operating characteristic curve.
