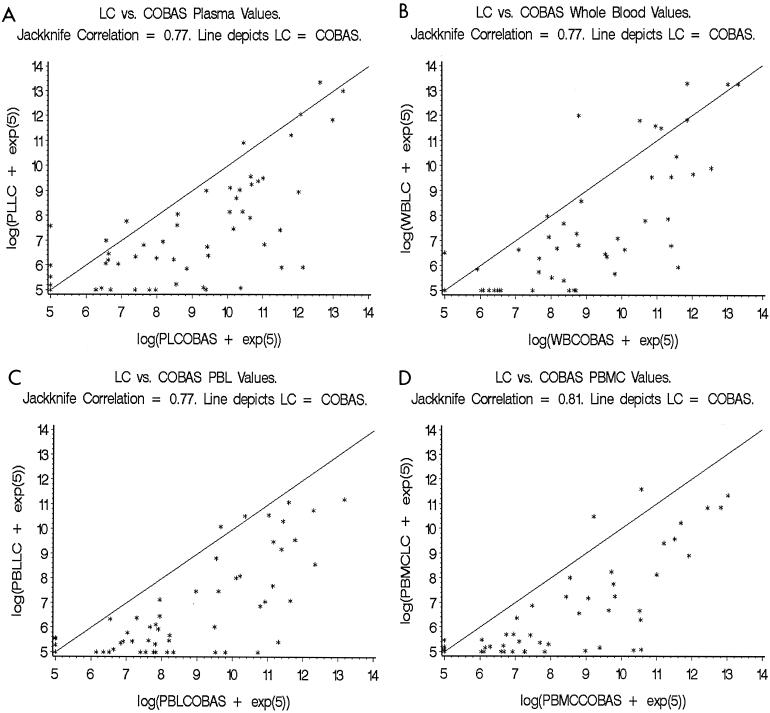
FIG. 2.
Jackknife analysis of correlation of the CMV DNA levels in different blood compartments (PL [A], WB [B], PBL [C], and PBMC [D]) as assessed by the LightCycler and COBAS AMPLICOR CMV Monitor. Note: Each point in the graphs represents an individual sample that was tested for CMV DNA using both the LightCycler (LC) and COBAS AMPLICOR CMV Monitor (COBAS). The x axis represents the log values of CMV DNA per milliliter of WB or PL and per 2 × 10⁶ PBL or PBMC as assessed by the COBAS, and the y axis represents the log values of CMV DNA per milliliter of WB or PL and per 2 × 10⁶ PBL or PBMC as assessed by the LC.

