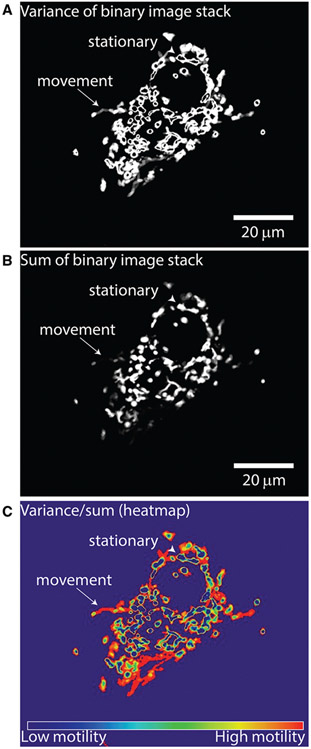
Figure 2.
Demonstration of step 2 of QuoVadoPro for the Cos-7 cell whose segmentation was illustrated in Figure 1. Following the binarization of images, in step 2, QuoVadoPro calculates the variance (A) and the sum (B) of each binary pixel over all time frames. The final motility heatmap (C) is represented as the ratio of variance over sum of intensity of each pixel. Pixels that contain a moving object, for example the mitochondrion that has moved toward the edge of the cell (arrow), display low sum and high variance. These pixels will therefore be represented as hot points on the heatmap. Pixels that contain a stationary object will have a low variance but a high sum, and will therefore appear as cold points on the heatmap (arrowhead).

