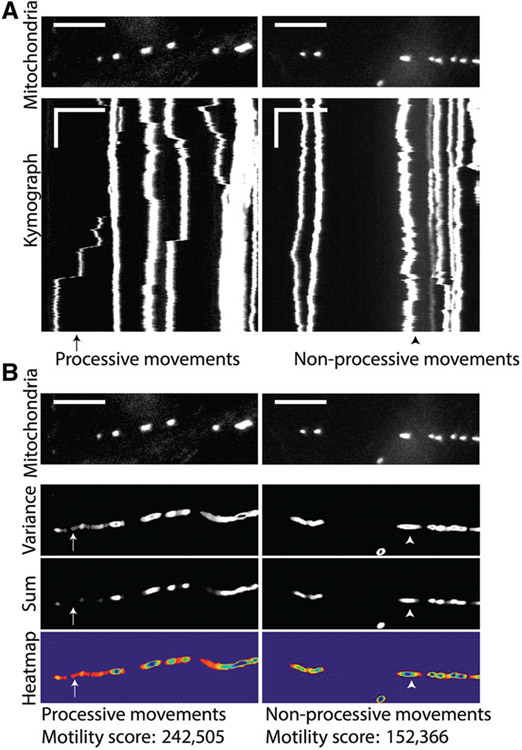
Figure 3.
Example of neuronal axons with fluorescently tagged mitochondria analyzed by QuoVadoPro, demonstrating that processive movements are weighted more heavily than back-and-forth movements. Two axon segments expressing fluorescent tags on mitochondria (mitoDsRed) are shown (A, top panels) along with their kymographs (A, bottom panels). These segments were analyzed by QuoVadoPro, and their respective variance images, sum images, and heatmaps along with final motility scores are depicted (B). One of the axons has processively moving mitochondria (an example is marked by the arrow), whereas the other contains mitochondria that are largely jiggling back and forth (an example is marked by the arrowhead). When analyzed over time, pixels containing processive movements show high variance and low sum (arrow, panel B). Binarized pixels depicting back-and-forth movements have a high variance and a high sum (arrowhead, panel B). The motility heatmaps are constructed as a ratio of variance over sum. Thus, processive movements create more hot points on the motility heatmaps compared to non-processive movements. Heatmaps that contain processively moving objects thus have a higher motility score than heatmaps of non-processive movements. Horizontal scale bars depict 15 μm and vertical scale bars indicate 30 s.

