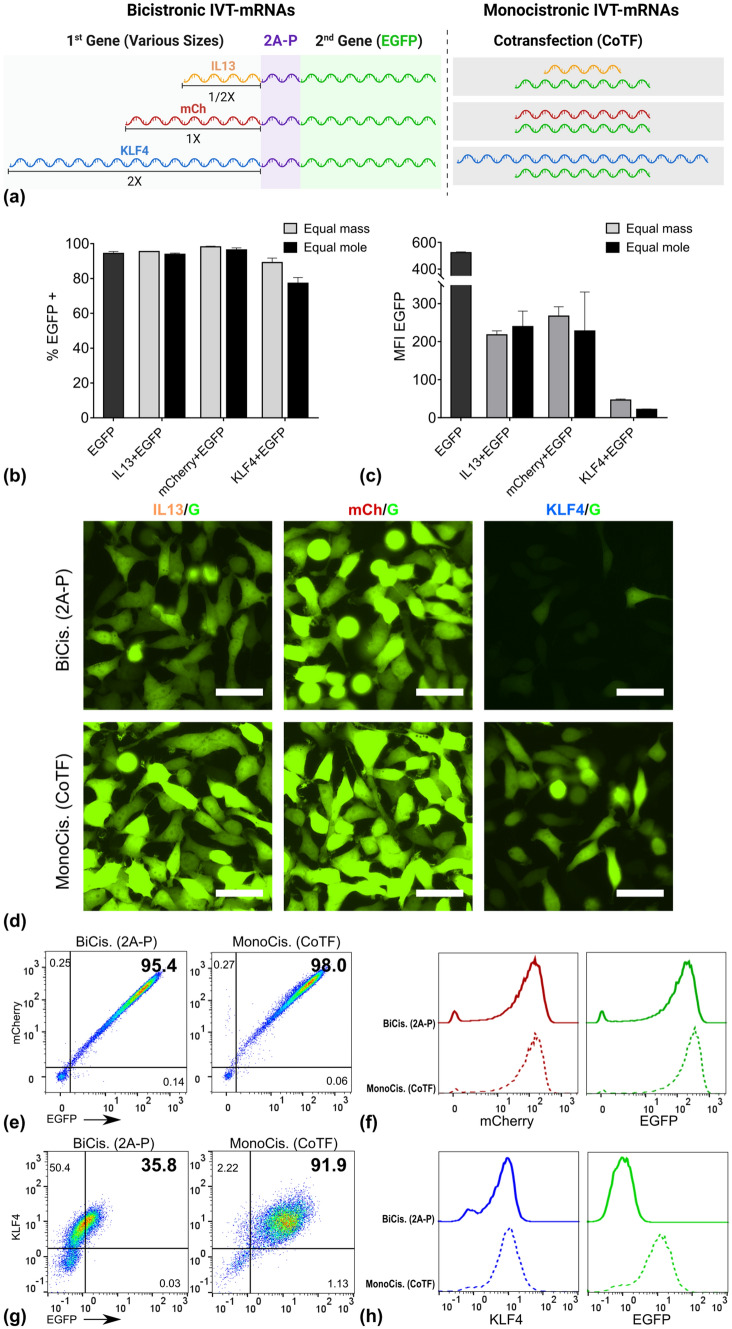
Figure 2.
Impact of size ratio of the first gene to the second gene on the co-expression of two genes. (a) schematic overview of constructs, which were used and compared in parallel, IL13 with half size of EGFP as the small, mCherry with similar size to EGFP as medium, and KLF4 with almost double size of EGFP as large constructs were delivered together with EGFP either in one cassette with 2A-P as self-cleavage site, or co-delivered. For the monocistronic approach the percentage of EGFP positive population (b) and intensity of EGFP signal (mean fluorescent intensity) (c) reflecting the EGFP expression were quantified using flow cytometric evaluation of cells. Corresponding data for the bicistronic approach are provided in Figure S2. (d) Fluorescent images of HeLa cells transfected with any of the three genes with different sizes with two different approaches. Percent of double positive cells shown in form of dot plots (e), as well as expression level of the first protein (mCherry) and second protein (EGFP) compared between the two methods (f). Similarly, percent of double positive cells (g) and evaluation of protein production for KLF4 as first protein and EGFP as second protein and (h), both measured via immunocytochemistry (ICC) and flow cytometry. Numbers indicated within dot plots represent % of cells inside the corresponding gate. Error bars indicate SD for three independently performed experiments. Scale bar = 50 µm. See Table S1 for precise numbers describing equimass versus equimolar transfection, corresponding to each method.

