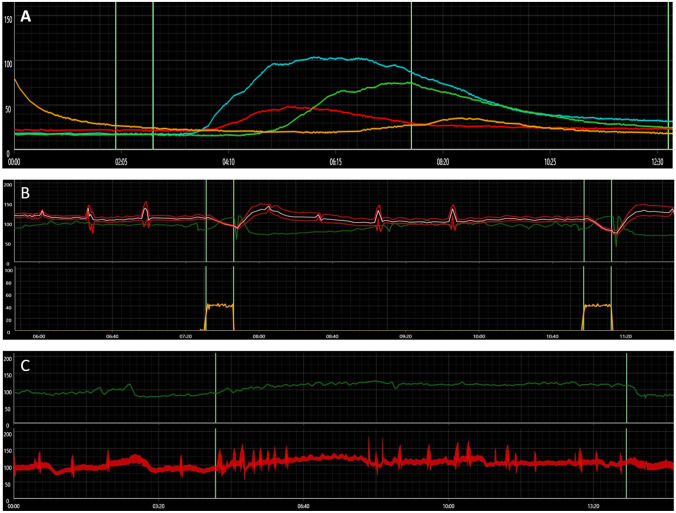
Fig. 1.
A quantitative sudomotor axonal reflex test showing reduced sweat outputs in the forearm (red) and foot (yellow) sites, while it is normal in the proximal and distal leg sites (blue and green curves, respectively). B Blood pressure response to Valsalva maneuver showing diminished late phase II with normal heart rate response. C Orthostatic tachycardiac response to head-up tilt table test (upper panel) with no significant change in blood pressure (lower panel)

