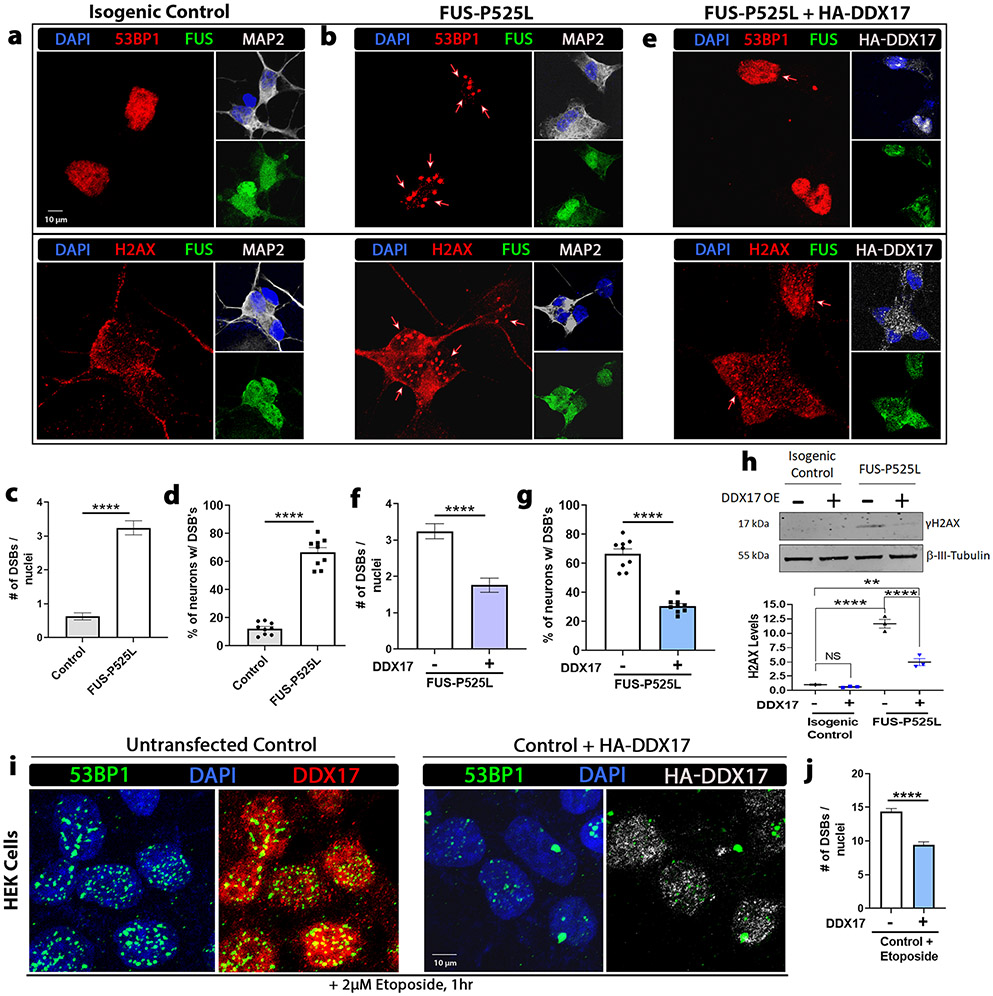
Fig. 5.
Upregulation of DDX17 mitigates DNA damage exhibited in mutant FUS iPSC neurons. Representative confocal images of a isogenic control and b, e mutant FUS iPSC neurons with and without overexpression of HA-DDX17 from the same set of neuronal differentiations. Neurons were probed for FUS, the DNA damage and double-strand break (DSB) markers γH2AX and p53-binding protein 1 (53BP1), HA-DDX17, and the neuronal marker microtubule-associated protein 2 (MAP2). Nuclei were stained with DAPI. c, d Quantification of the number of DNA DSBs and the percentage of neurons with DSBs between control (panel a) and mutant FUS-P525L (panel b) (n = 60–70 neurons, unpaired students t-test). Mutant FUS-P525L neurons show a significant increase in the number of DNA DSBs per neuron compared to control. f, g Quantification of the number of DNA DSBs and the percentage of neurons with DSBs between mutant FUS-P525L (panel b) and mutant FUS-P525L with overexpression of HA-DDX17 (panel e) (n = 60–70 neurons, unpaired students t-test). Mutant FUS-P525L neurons expressing HA-DDX17 show a significant decrease in the number of DNA DSBs per neuron compared to mutant FUS-P525L alone. h Representative blots of γH2AX protein in isogenic control and mutant FUS-P525L neuronal cells with and without overexpression of DDX17. β-tubulin III was used as a loading control (n = 3 blots, One-way ANOVA w/ Turkey’s multiple comparisons). FUS-P525L neurons showed a significant increase in γH2AX protein levels compared to FUS-P525L neurons expressing HA-DDX17. i Confocal images of HEK cells exposed to the DNA damage-inducing agent, etoposide (2 μM), for 1 h after being transduced with and without HA-DDX17 for 72 h. The cellular distributions of 53BP1, HA-DDX17, and endogenous DDX17 were assessed. j Quantification of the number of DNA DSBs between HEK cells exposed to etoposide with and without over expression of HA-DDX17 (n = 70–80 cells, unpaired students t-test). Cells over expressing DDX17 show a significant decrease in the number of DNA double-strand breaks per cell compared to control after etoposide exposure. Error bars indicate S.E.M. **p < 0.01, ****p < 0.0001

