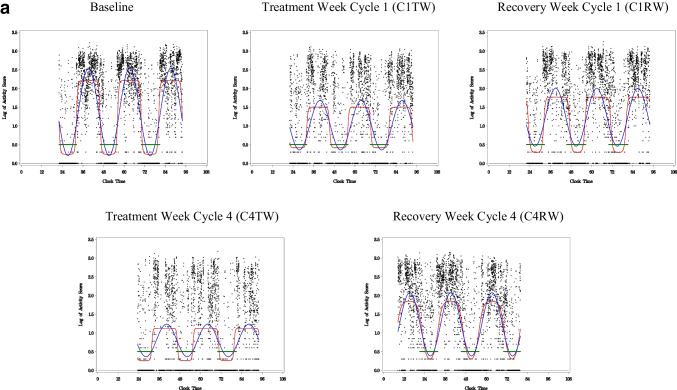
Fig. 2.
Example of a weak CAR. This woman with BC showed a robust sleep-wake rhythm at baseline indicated by clear contrast between daytime and nighttime activity. The rhythm then became disrupted during the first week of chemotherapy treatment (C1TW) and remained disrupted for the duration of chemotherapy, as indicated by lower amplitude and less contrast between bedtime and wake time. X-axis is clock time. Y-axis is log value. Black dots, log of activity scores calculated by the actigraphy. Blue line, best-fitting traditional cosine curve. Red line, extended cosine curve. Green line, in-bed time

