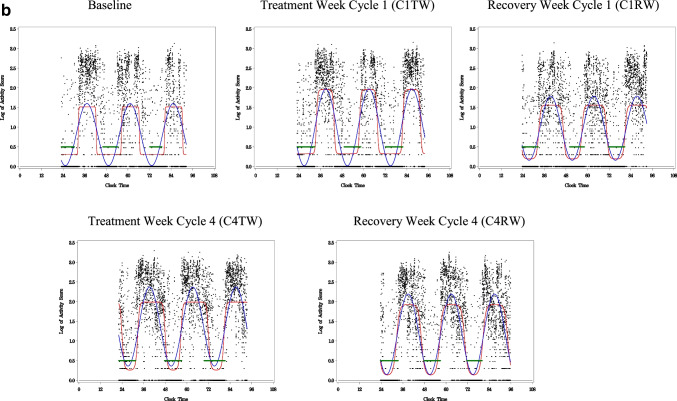
Fig. 3.
Example of a robust CAR. This woman with BC showed a robust sleep-wake rhythm at baseline, indicated by clear contrast between daytime and nighttime activity. This patient’s rhythm remained overall stable and robust throughout chemotherapy. X-axis is clock time. Y-axis is log value. Black dots, log of activity scores calculated by the actigraphy. Blue line, best-fitting traditional cosine curve. Red line, extended cosine curve. Green line, in-bed time

