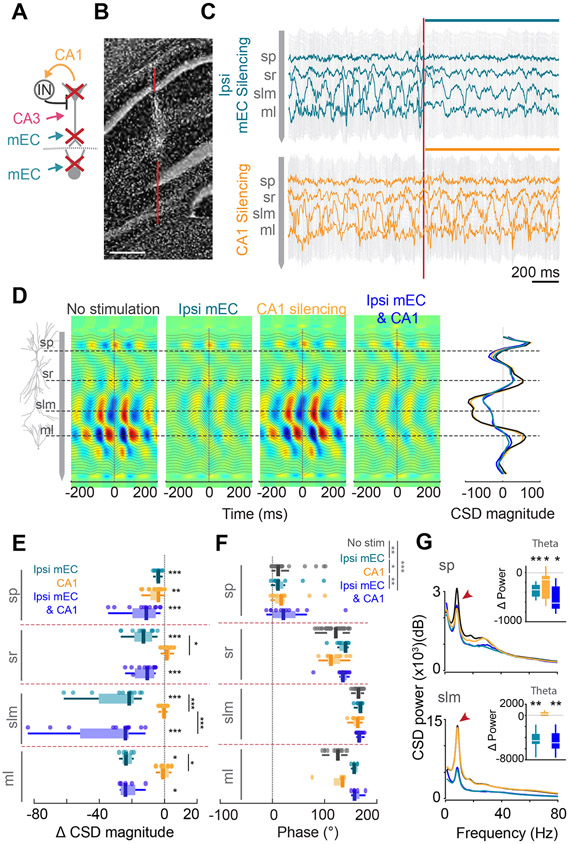
Figure 3. Minimal effect of local CA1 silencing on theta oscillations.
(A) Schematic of silencing strategy.(B) Track of the linear silicone probe. (C) 2s-long LFP traces during ipsi mEC (top) and local CA1 (bottom) silencing. An immediate decrease in theta power was observed upon ipsi mEC silencing. Vertical red line is light onset. LFP traces recorded from sp, sr, slm and ml are highlighted. (D) Average theta CSD profiles during control, ipsi mEC, CA1 and combined silencing. Reduction of sink-source pairs was observed only for manipulations with ipsi mEC silencing. Right, average CSD magnitude at time 0, overlaid across all 4 conditions. (E) Average change in CSD magnitude across different hippocampal layers for each of the manipulations (each dot represents one session from one animal, n = 11 sessions across 4 mice; within layer: Wilcoxon signed rank test against 0; across layers: 2-way ANOVA followed by Tukey-Kramer posthoc tests, layer* manipulation interaction, F(6,102) = 5.33, p < 0.001; only within-layer post-hoc results shown). (F) Theta phase reversal (with respect to so theta phase) across sp to ml was preserved during all manipulations (n = 11 sessions across 4 mice, 2 way ANOVA followed by Tukey-Kramer posthoc tests, layer*manipulation interaction, F(9,212) = 1.83, p = 0.065, manipulation, F(3,212) = 8.44, p < 0.001, layer F(3,212) = 461.07, p < 0.001. Each layer was different from each other, p<0.05). (G) Left, Average power frequency spectra of CSD across all mice (n = 4) upon ipsi mEC, CA1 and combined ipsi mEC and CA1 silencing for sp and slm. Red arrows, theta peak. Right, Change in theta (6-12 Hz) CSD power for each manipulation compared to baseline in sp and slm (n[Ipsi mEC, CA1, ipsi mEC & CA1] = 9, 9 and 9 sessions from 4 mice, Wilcoxon two sided signed rank test against 0. sp: Theta, p = 0.004, 0.02, 0.02 respectively, slm: Theta, p = 0.004, 0.16, 0.004 respectively). Color legend in E. *p<0.05, **p<0.01, ***p<0.001. All box plots show median ± interquartile; whiskers show range excluding outliers. See also Figures S2, S4.

