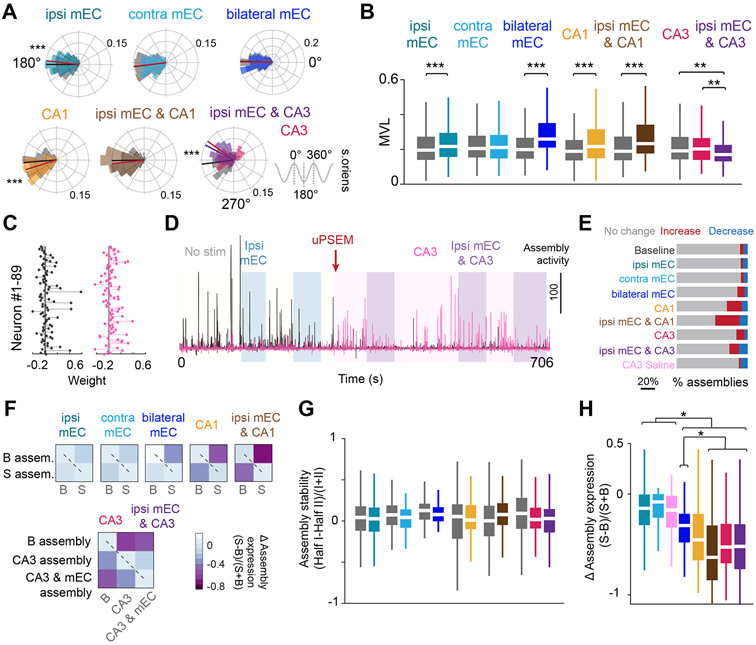
Figure 5. Theta phase preference of spiking is controlled distinctly by inputs.
(A) Distribution of theta phase angle preferences of all CA1 pyramidal cells during no stimulation in the central arm, compared to each respective manipulation. Radial axis represents probability for each bin. Small but opposite shifts in the phase preference were observed during ipsi mEC and CA1 silencing, whereas CA3 silencing led to an ~30 degree shift in preferred phase angle. Only cells that were significantly modulated by theta (Rayleigh test, p < 0.05) were included in the analysis (Wilcoxon ranksum test, ipsi mEC, Z = 3.65, p <0.001, contra mEC, Z = 0.145, p = 0.885, bilateral mEC, Z = −0.316, p = 0.752, CA1, Z = −3.91, p < 0.001, ipsi mEC & CA1, Z = −1.24, p = 0.216, CA3, ipsi mEC & CA3, Kruskal-Wallis test followed by Tukey-Kramer posthoc tests, Chi-square(2,1054) = 52.06, p<0.001, baseline is significantly different from CA3 and ipsi mEC and CA3, p <0.001). Gray shaded areas (and black line) are baseline, colored shaded areas (and lines) are stimulation. (B) Most manipulations resulted in an increase in the mean vector length (MVL) of locking to theta phase for individual cells (Wilcoxon ranksum test, ipsi mEC, Z = −5.185, p < 0.001, contra mEC, Z = 0.115, p = 0.908, bilateral mEC, Z = −9.57, p < 0.001, CA1, Z = −4.185, p < 0.001, ipsi mEC & CA1, Z = −5.45, p< 0.001, CA3, ipsi mEC & CA3, Kruskal-Wallis test followed by Tukey-Kramer posthoc tests, Chi-square(2,1054) = 14.84, p<0.001). (C) The relative weights of each neuron for two example assemblies. (D) Assembly expression over time of the two assemblies shown in C. The black assembly is highly expressed during no stimulation and ipsi mEC silencing but is diminished after PSAM inactivation of CA3. The opposite effect is observed for the pink assembly. (E) Bilateral mEC, CA1, and CA3 manipulations either increased or decreased cell assemblies identified during baseline runs (see STAR Methods). (F) Assemblies were defined separately for the first and second halves of baseline and stimulation sessions, and the change in assembly expression was quantified. Both baseline and stimulation assemblies had minimal changes in expression between the two halves (i.e., diagonal, dashed line), but assembly expression decreased across conditions (i.e., anti-diagonal). (G) Assembly stability (comparisons along the diagonal from F) was preserved within all manipulations (Wilcoxon two-sided signed rank test, ipsi mEC, p = 0.51, contra mEC, p = 0.42, bilateral mEC, p = 0.155, CA1, p = 0.70, ipsi mEC & CA1, p = 0.26, CA3, ipsi mEC & CA3, Kruskal-Wallis test followed by Tukey-Kramer posthoc tests, Chi-square(2,402) = 5.75, p= 0.06). Color legend in B. (H) Bilateral mEC, CA1 and CA3 manipulations led to the largest change in assembly expression across baseline versus manipulated runs (quantification of the top-right boxes from each heatmap in F) (Kruskal-Wallis test followed by Tukey-Kramer posthoc tests, Chi-square (7,949) = 244.85, p<0.001). Color legend in E. *p<0.05, **p<0.01, ***p<0.001. All box plots show median ± interquartile; whiskers show range excluding outliers. See also Figure S5.

