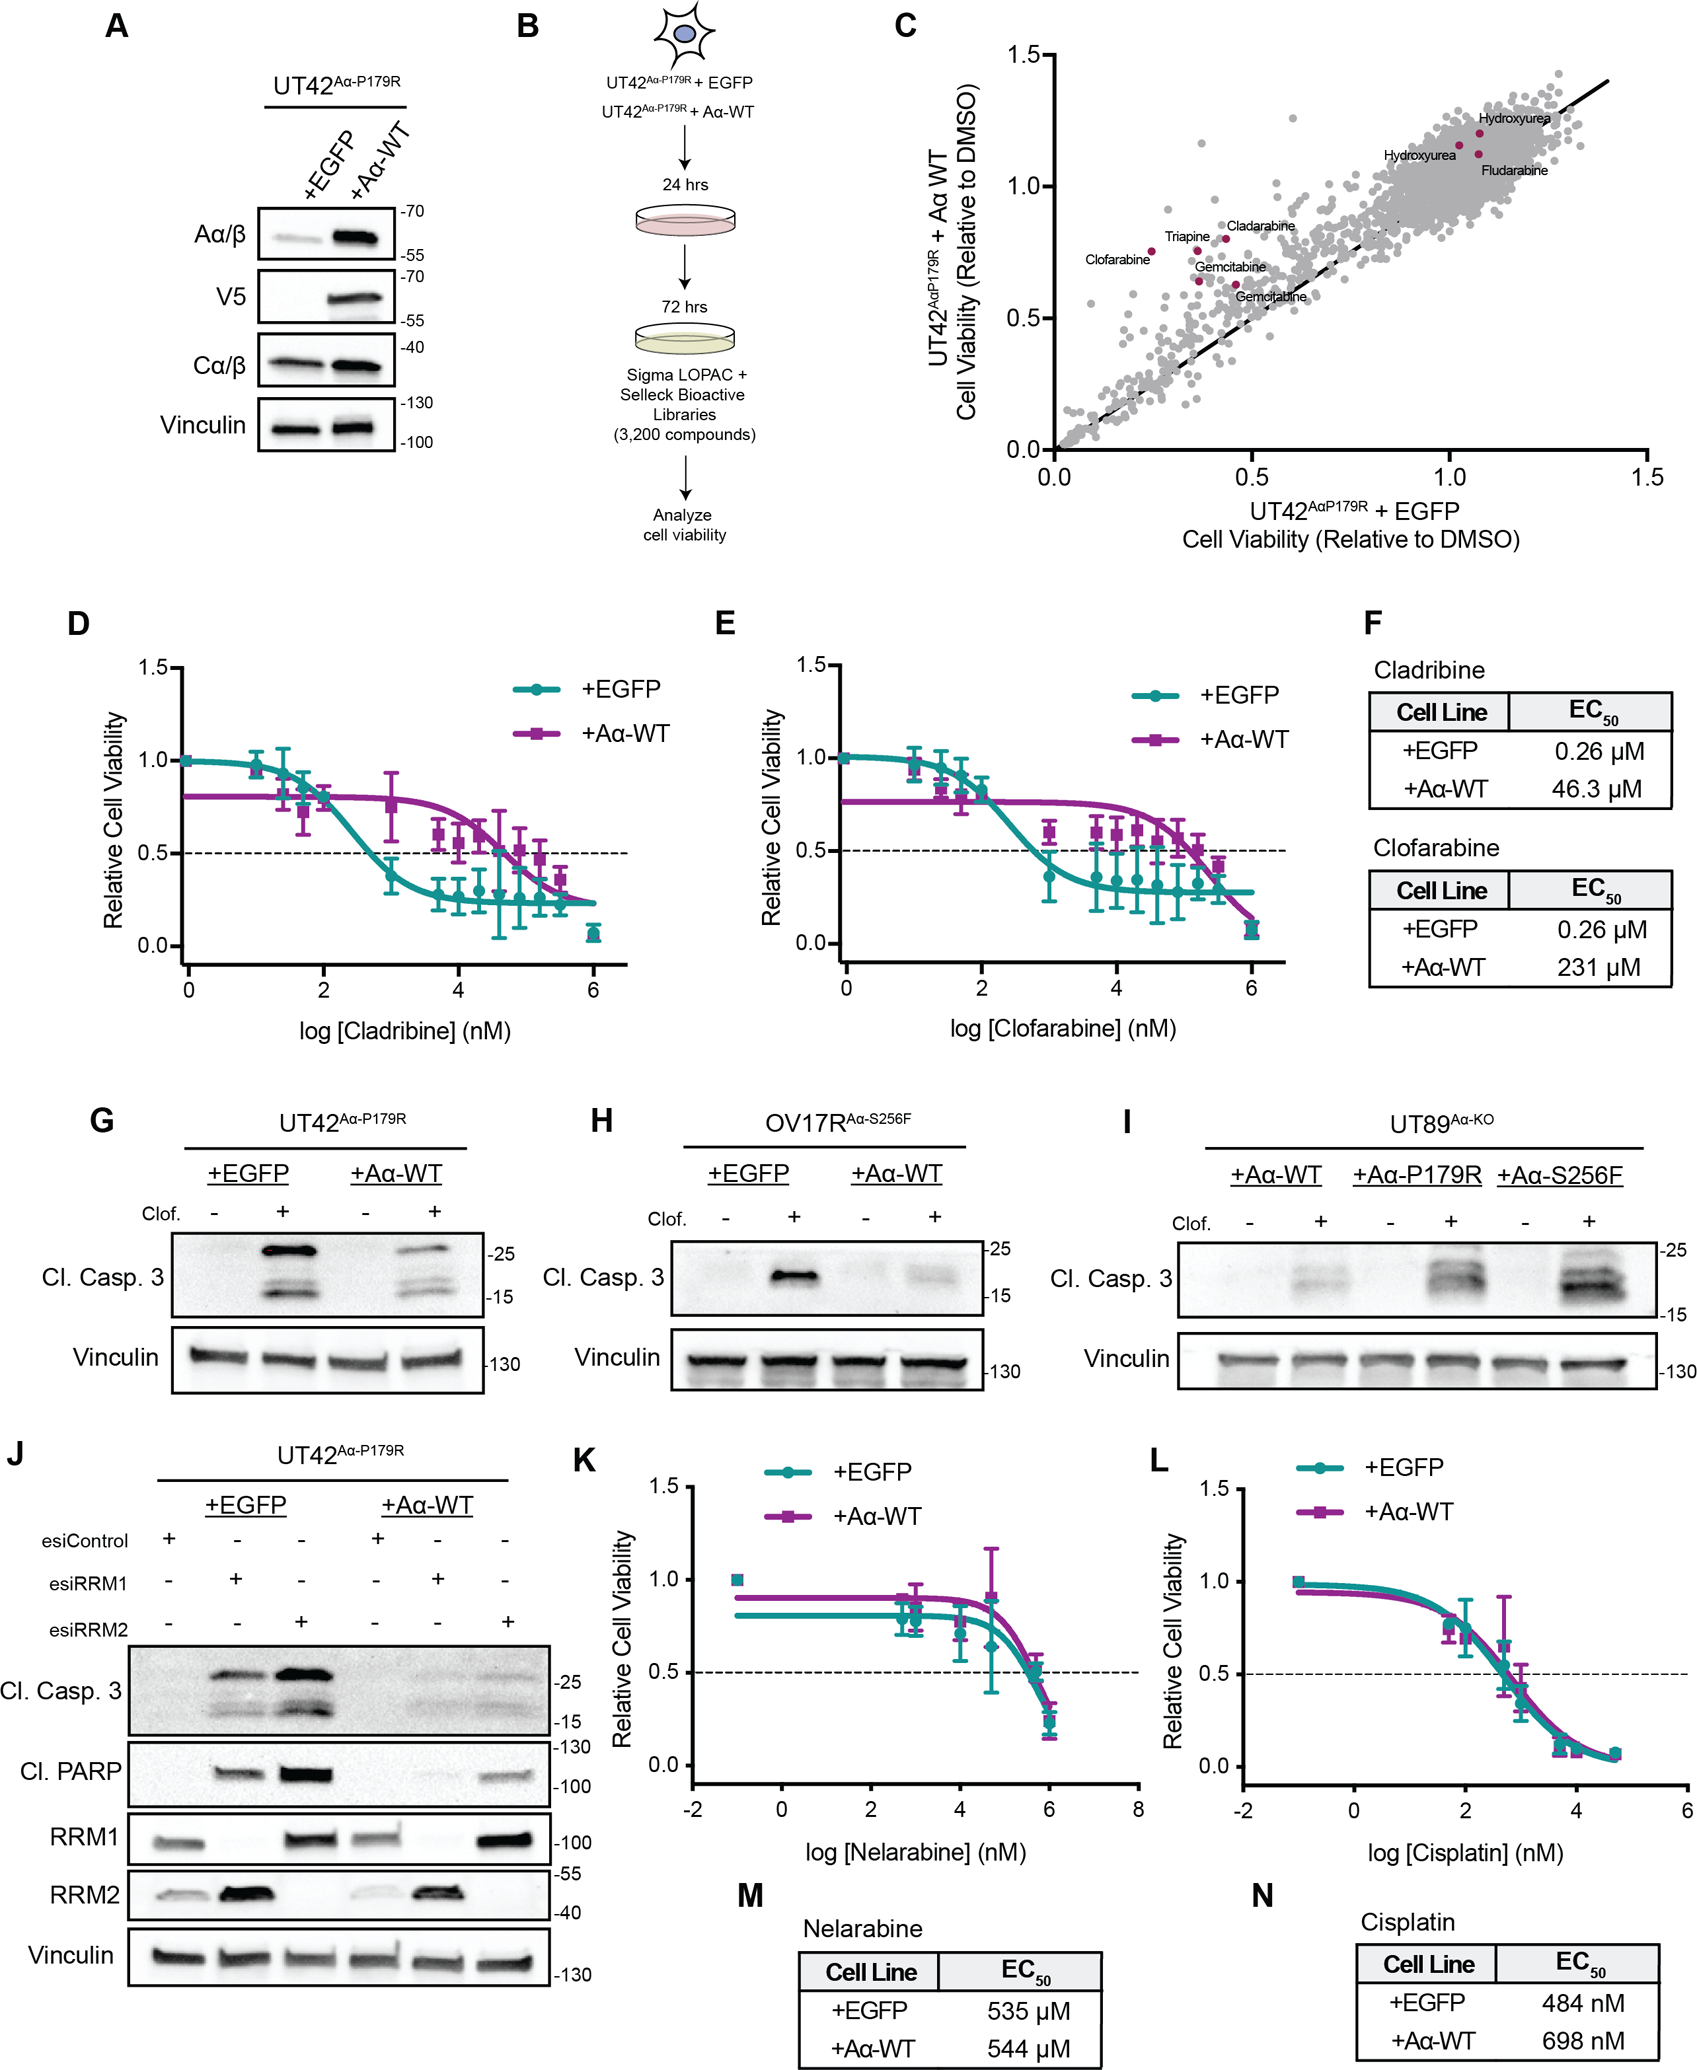
Figure 1. High throughput screening identifies PP2A A⍺ mutations sensitize cancer cells to RNR inhibitors.

A, Representative western blot of UT42Aα-P179R isogenic cells expressing EGFP or WT Aα protein demonstrating overexpression. B, Schematic of the high-throughput screening workflow. C, Overview of the viability results from all 3,200 compounds, with the viability of the EGFP expressing cells on the x-axis and the viability of the WT Aα protein expressing cells on the y-axis. Compounds included in the screen which are classified to harbor activity for ribonucleotide reductase from the high throughput screen were highlighted in red. D&E, Dose response curves of UT42 isogenic cells treated with Cladribine (D) or Clofarabine (E) as measured by MTT, n=3 biological replicates, error bars ± SD. F, Calculated EC50 values from the MTT assays in D and E (calculated from the average of all biological replicates). G-I, Isogenic UT42Aα-P179R (G), OV17RAα-S256F (H) or UT89 CRISPR Aα-KO cells (I) were treated with Clofarabine and representative immunoblots of the apoptotic marker Cleaved Caspase 3 is shown, n=3 biological replicates. Quantification from the immunoblots shown is represented in Supplemental Figure 3. J, Representative immunoblot of apoptotic markers Cleaved Caspase 3, Cleaved PARP, or RRM1 and RRM2 in isogenic UT42Aα-P179R cells with knockdown of RRM1, RRM2, or RLUC (Control) at 72 hrs., n=3 biological replicates. K&L, Dose response curves of UT42 isogenic cells treated with Nelarabine (K) or Cisplatin (L) as measured by MTT, n=3 biological replicates, error bars ± SD. M&N, Calculated EC50 values from the MTT assays in K and L (calculated from the average of all biological replicates).
