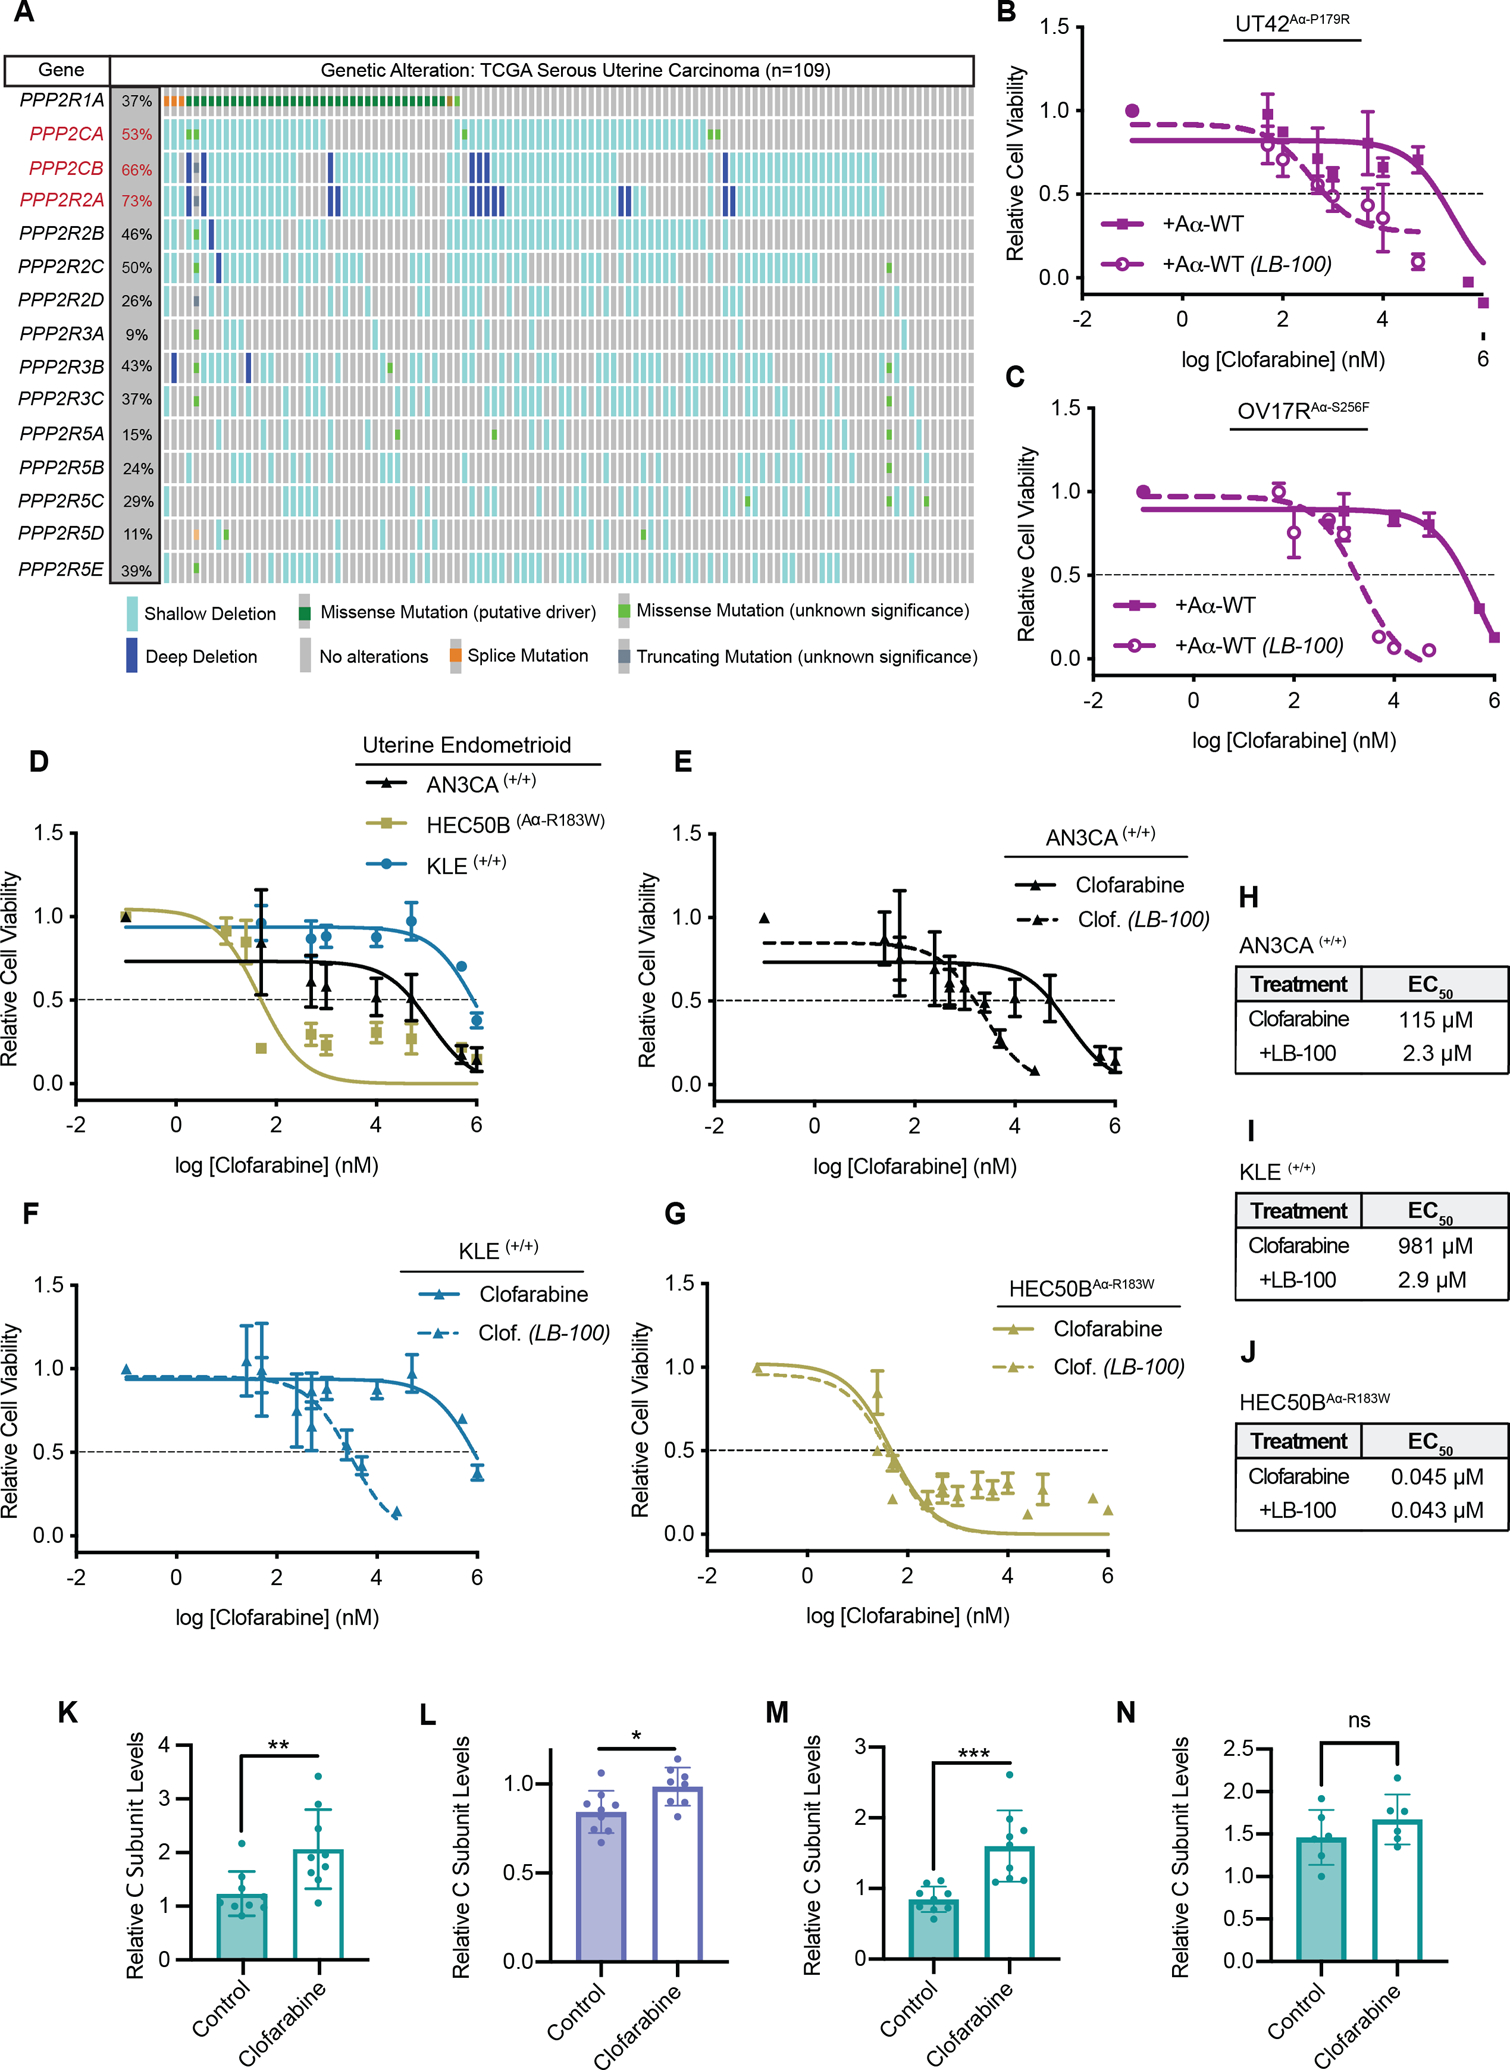
Figure 4: Loss of PP2A subunit expression is common in USC and inactivation of PP2A sensitizes to Clofarabine.

A, Analysis of heterozygous and homozygous loss of canonical PP2A subunits in uterine serous carcinoma samples from the TCGA. Subunits with loss at greater than 50% are highlighted in red. In aggregate, 101 of 109 USC patients harbor some alteration to PP2A. B and C, Dose response curve for UT42Aα-P179R cells expressing WT Aα (B) or OV17RAα-S256F cells expressing WT Aα (C) were treated with Clofarabine with or without LB-100 in increasing doses held at a constant ratio, n=3 biological replicates, error bars ± SD. D, Dose response curves of AN3CA, HEC50B, and KLE cells treated with Clofarabine as measured by MTT at 72 hrs, n=3 biological replicates, error bars ± SD. Clofarabine alone data from figure D included in panels E-G. E-G, Dose response curve for AN3CA (E), KLE (F) or HEC50B (G) cells treated with Clofarabine with or without LB-100 in increasing doses held at a constant ratio, 72hrs, n=3 biological replicates, error bars ± SD. H-J, Calculated EC50 values from the MTT assays in E-G (calculated from the average of all biological replicates). K, Quantification of total C Subunit levels in UT42Aα-P179R terminal efficacy xenograft tumors as measured by western blot. All tumors normalized to the average of two control tumors. Error bars ± SD, (Students T-test, p-values *** < 0.001). L, Quantification of total C Subunit levels in UT89Aα-KO + S256F terminal efficacy xenograft tumors as measured by western blot. All tumors normalized to the average of two control tumors. Error bars ± SD, (Students T-test, p-values * < 0.05). M, Quantification of total C Subunit levels in UT89Aα-KO + P179R terminal efficacy xenograft tumors as measured by western blot. All tumors normalized to the average of two control tumors. Error bars ± SD, (Students T-test, p-values *** < 0.001). N, Quantification of total C Subunit levels in UT42Aα-P179R pharmacodynamic xenograft tumors from Figure 2G. All tumors normalized to the average of two control tumors. Error bars ± SD, (Students T-test, p-values *** < 0.001). Westerns for (K-N) can be found in Supplemental Figure 8.
