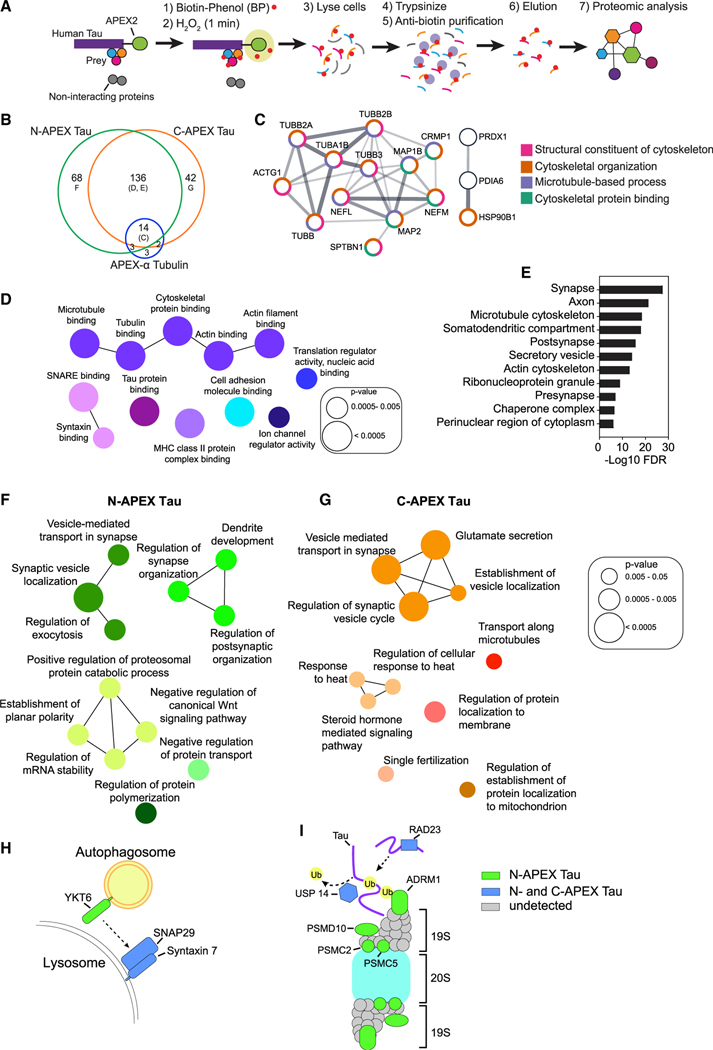
Figure 2. Subcellular and subprotein domain Tau interactome in living human neurons identified by APEX-mediated biotinylation.
(A) Workflow for proximity-dependent identification of Tau-associated proteins.
(B) Venn diagram of biotinylated proteins detected in human neurons with N-APEX Tau (n = 7 cultures), C-APEX Tau (n = 9 cultures), or APEX-α Tubulin (n = 12 cultures). See also Table S1.
(C) N-APEX Tau, C-APEX Tau, and APEX-α Tubulin biotinylated proteins include components of the microtubule cytoskeleton. Only interconnected nodes based on the Search Tool for the Retrieval of Interacting Genes/Proteins (STRING) database are shown. Function pathway analyses categories are grouped by color.
(D) ClueGO molecular function pathway enrichment of proteins biotinylated by both N-APEX Tau and C-APEX Tau but not APEX-α Tubulin. Node colors denote functionally grouped networks (kappa connectivity score ≥ 30%).
(E) Gene Set Enrichment Analysis (GSEA) on proteins biotinylated by both N-APEX and C-APEX Tau showing major cellular component categories.
(F and G) ClueGO biological processes pathway enrichment of proteins biotinylated only by N-APEX Tau (F) and only by C-APEX Tau (G).
(H and I) Subprotein-level APEX Tau associations identified that regulate autophagy (H) and proteasome degradation (I).

