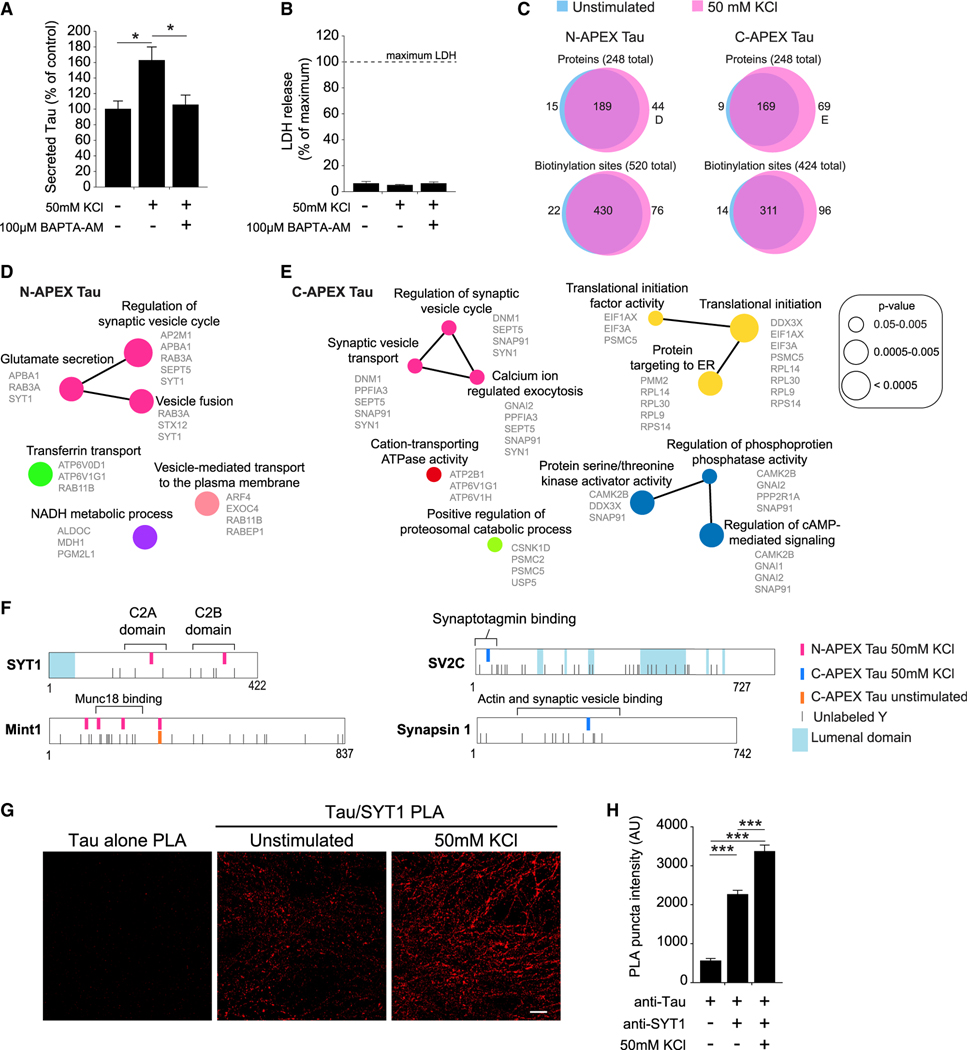
Figure 4. Activity-induced changes in the Tau interactome during activity-dependent Tau secretion from human neurons.
(A) Quantification of Tau secreted from human neurons treated with high KCl to enhance neuronal activity and BAPTA-AM, a membrane-permeable calcium chelator. Secreted Tau measured by ELISA was normalized to total Tau in the neuron culture (n = 8–9 cultures/group, *p < 0.05, one-way ANOVA, Bonferroni post hoc analyses). Values are given as means ± SEM.
(B) Lactate dehydrogenase (LDH) levels in the media collected from human neurons after 30 min with or without high KCl (n = 8–9 cultures/group). Values are given as means ± SEM.
(C) Venn analyses of the biotinylated proteins and the individual biotinylation sites labeled by N-APEX Tau and C-APEX Tau without stimulation (blue, data from Figure 2B, n = 7–9 cultures/group) and with enhanced neuronal activity (red, n = 7–9 cultures/group). See also Table S3.
(D and E) ClueGO biological processes pathway enrichment of proteins biotinylated by (D) N-APEX Tau or by (E) C-APEX Tau in neurons with KCl-induced activity. Analyses were performed on the 44 (D) and 70 (E) biotinylated proteins labeled in (C). See also Figure S4.
(F) Activity-induced biotinylated residues detected on synaptic vesicle-associated proteins.
(G) Images of PLA fluorescence with Tau5 and SYT1 antibodies in unstimulated and high-KCl-stimulated human neurons. Scale bars, 5 μm. See also Figure S3.
(H) Tau5 and SYT1 PLA puncta fluorescence intensity in human neurons with and without KCL-enhanced activity (n = 6–12 images/group, ***p < 0.001, one-way ANOVA, Bonferroni post hoc analyses). Values are given as means ± SEM.

