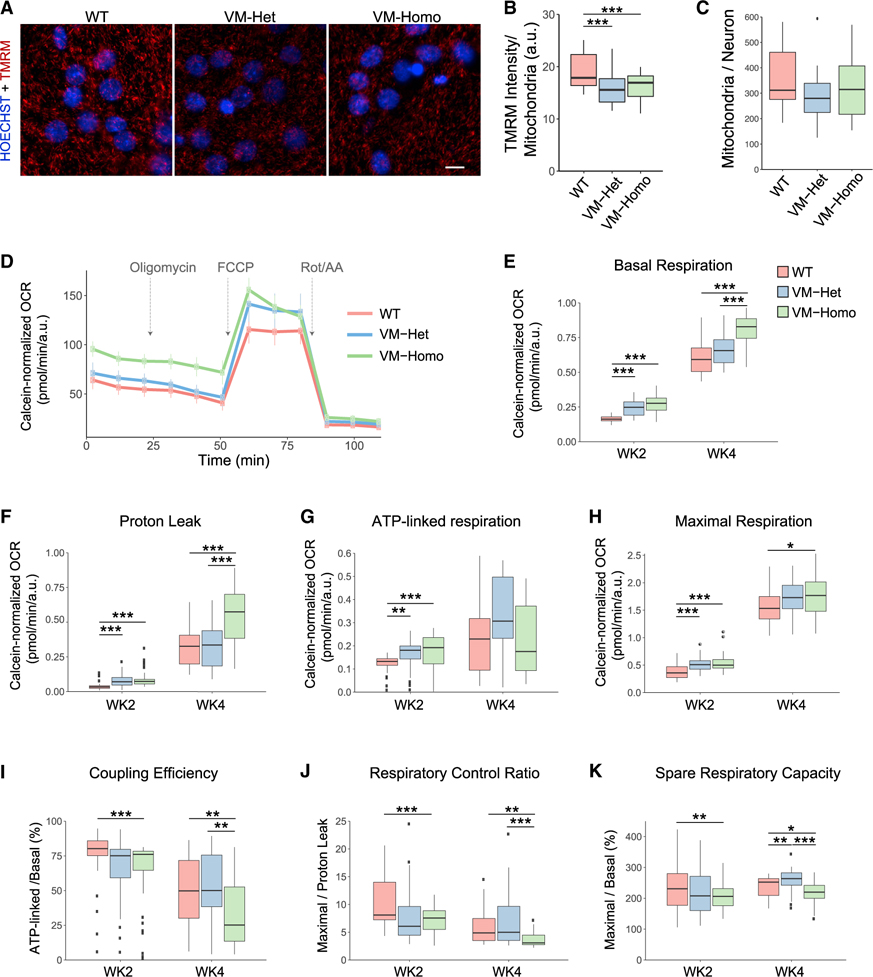
Figure 6. TauV337M neurons display mitochondrial bioenergetic alterations.
(A) Images of 4-week-old TauWT, TauV337M-Het (VM-Het), and TauV337M-Homo (VM-Homo) neurons incubated with TMRM (red) and hoechst 33342 (blue). Scale bars, 5 μm.
(B) TMRM intensity analysis of TauWT, TauV337M-Het, and TauV337M-Homo neurons at baseline or treated with oligomycin (n > 30,000 mitochondria/replicate from two independent experiments and >8 internal replicates/genotype and treatment, ***p < 0.001, linear mixed-effects model with Tukey’s post hoc analyses).
(C) Quantification of mitochondria number per neuron from experiments depicted in (A).
(D) Representative OCR measurements obtained from Seahorse assays with TauWT, TauV337M-Het, and TauV337M-Homo neurons normalized to calcein intensity. Arrows indicate addition of oligomycin, FCCP, and rotenone+antimycin A (Rot/AA).
(E–H) Quantification of basal respiration (E), proton leak (F), ATP-linked respiration (G), and maximal respiration (H) from Seahorse experiments depicted in (D) with 2- and 4-week-old neurons (from 3 experiments and 8 technical replicates/condition, ***p < 0.001, **p < 0.01, *p < 0.05, linear mixed-effects model with Tukey’s post hoc analyses).
(I–K) Coupling efficiency (I), respiratory control ratio (J), and spare respiratory capacity (K) were calculated using the indicated parameters from the Seahorse experiments depicted in (D–F) (***p < 0.001, **p < 0.01, *p < 0.05, linear mixed-effects model with Tukey’s post hoc analyses). The center lines in boxplots (B–K) represent the median with the 25th and 75th percentiles marked by the box limits. The bars extend to the farthest data points and the dots outside of the bars are outliers.

