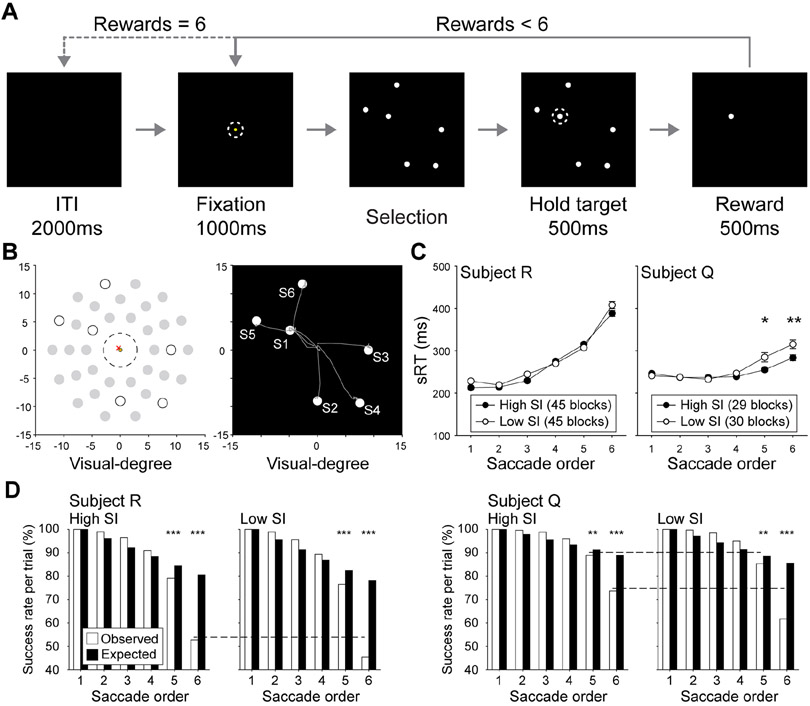
Figure 1.
Spatial self-ordered search task. (A) On each trial, monkeys fixated a yellow point in the center of the screen and were shown a configuration of 6 identical targets (white circles). They made a selection (dashed line) by saccading to and holding fixation on one target. If the target had not been visited on that trial, a reward was delivered, and the monkey had to move his eyes back to the central fixation point before making another selection. This continued until all targets were visited once, at which point the trial ended and was followed by an intertrial interval (ITI). (B) An example trial with the target selection pattern. Gray trajectories indicate saccade paths starting from fixation to each target. S1 to S6 indicates target selection order. (C-D) Blocks were divided into high and low SI groups by a median split of each session. (C) A multiple linear regression model predicted RTs from saccade order, high/low SI block, and order x block interaction. In both subjects, RTs increased across saccades, suggesting later selections were more difficult (main effect of order p < 0.001 for both). For subject R, RTs during high SI blocks were faster than low SI blocks (main effect of SI block p < 0.05), and for subject Q, there were faster RTs during high SI blocks on the last two saccades (order x SI block interaction p < 0.001, post-hoc comparisons, *p < 0.05, **p < 0.01). (D) Monkeys make more errors than expected later in selection sequences. Expected success rates were calculated as a linear function of the number of potentially incorrect saccades possible at each selection (see STAR Methods), and observed rates were the number of correct selections divided by the total number of trials (Chiang and Wallis, 2018b). Monkeys performed better than the expected when WM loads were low, but performance declined precipitously when capacity was exceeded (binominal tests, **p < 0.01, ***p < 0.001). Performance was enhanced on high SI blocks specifically during later target selections, when WM began to falter (Chi-square tests, dashed lines indicate p ≤ 0.01).

