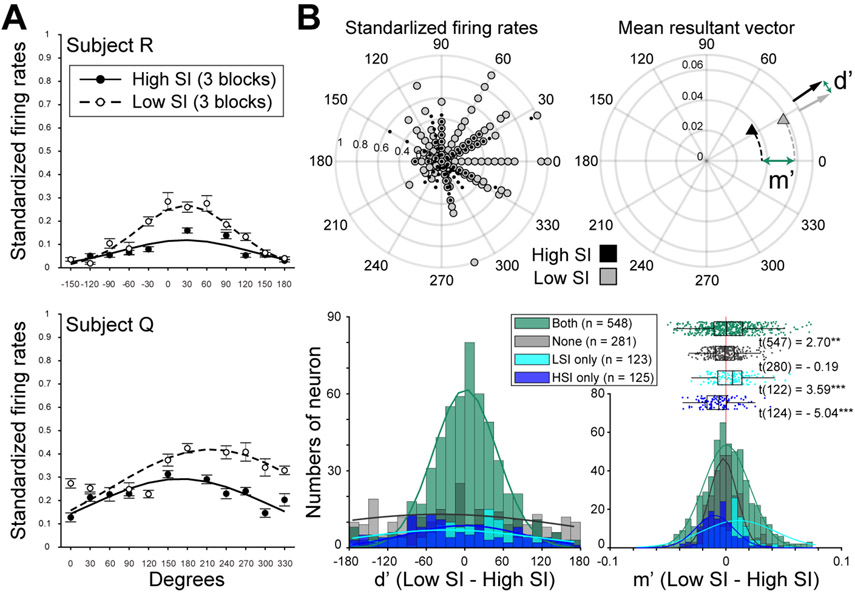
Figure 2.
Sequencing strategies decrease spatial tuning among single neurons. (A) Two single-neuron examples, recorded from subject R (left) and Q (right), showing the effects of the sequencing strategies on spatial tuning. The x-axis refers to the angle, in polar coordinates, of the selected target on the screen. Filled circles are from the three blocks in an exemplar session with higher SIs. Empty circles are from the three blocks in the same session with lower SIs. Flatter tuning curves were observed when the animal was searching through the targets using a more stereotyped strategy (Chiang and Wallis, 2018b). (B) Changes in spatial tuning were quantified by the change in direction (d’) and magnitude (m’) of resultant vectors for standardized firing rates in high and low SI blocks. The first circular plot shows standardized firing rates for one example neuron. The second shows the end points of the resultant vectors for each group (triangles), with m’ and d’ measures. Histograms show d’ and m’ for each single unit, grouped according to when they exhibited spatial selectivity: in both high and low SI blocks (green), low SI only (teal), high SI only (blue), or neither (gray). The direction of spatial tuning shifted slightly in the high SI group (deviation from zero degrees t124 = −2.51, p = 0.013), when directional tuning was weak. Other groups showed no shift in tuning direction (p > 0.05). In contrast, there was consistently stronger tuning in low SI blocks (positive m’) among neurons that exhibited spatial tuning in low SI only or both low and high SI blocks, constituting the majority of recorded neurons. Those with spatial tuning in high SI blocks only had significantly negative m’ distributions, and those with no tuning had distributions centered at zero. **p < 0.01. ***p < 0.001.

