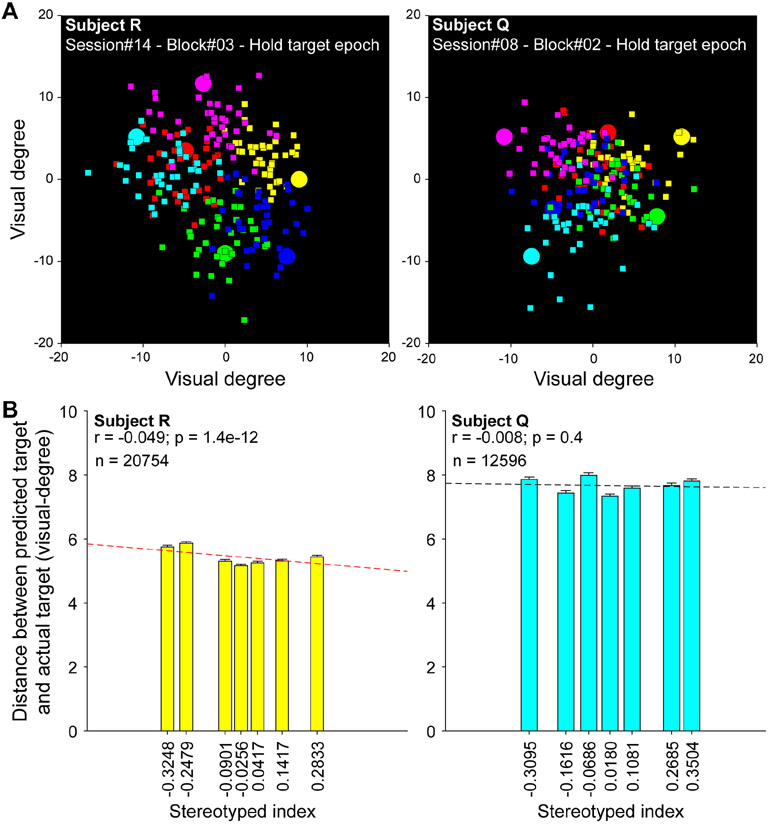
Figure 4.
Two-dimensional spatial decoding. (A) Example target configurations, in which each target (circles) is color-coded, to show the corresponding locations of the predicted targets (squares). Different color labels were used for visualization only; targets in the task were identical. Note that the decoder was trained and tested across blocks with different SIs and target configurations, but the same neuron ensemble. (B) Decoding performance was quantified for each target selection as the Euclidean distance between actual and predicted targets and plotted as a function of SI. Performance improved with SI in subject R and was unaffected subject Q, demonstrating no loss of spatial information at the population level with more stereotyped behaviors. For data visualization, the original scatter plots (Supplemental Figure S5) were binned by SI into 7 subgroups with an equal number of observations in each. The SI value on x-axis for each bar is the mean of SIs within the subgroup.

