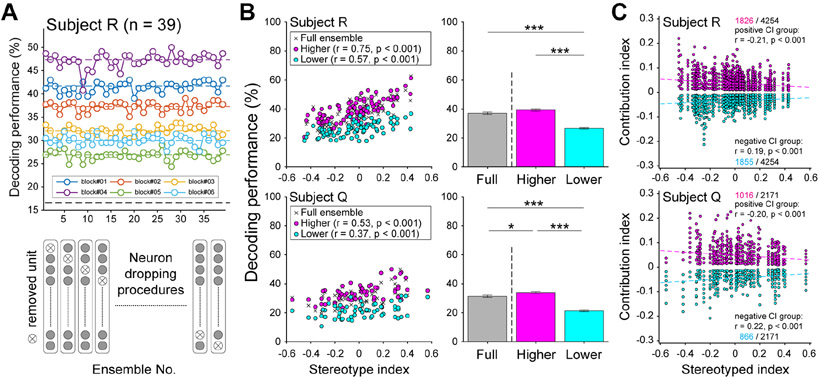
Figure 5.
Units make smaller contributions to the ensemble when behavior is more sequenced. (A) Diagram of the neuron dropping procedure in a sample recording session. Six blocks from the same session are labeled by different colors. Average performance from a saccade order decoder (y-axis) varied across blocks. In the neuron dropping procedure, the same decoder was run while iteratively removing one unit from the ensemble (bottom schematic). (B) Scatter plots show block-wise mean saccade order decoding as a function of SI for the full ensemble (+), higher contribution (magenta), and lower contribution (cyan) subgroups. Decoding performance corresponds to the proportion of target selections accurately classified. Bar plots show the overall means, collapsed across SI. (Pairwise t-tests, ***p < 0.001, *p < 0.05). (C) Population data showing CI as a function of SI. Each point is the contribution of one neuron to one block. Neurons making positive contributions (magenta) improved decoder performance, while those making negative contributions (cyan) reduced it. The contributions of the positive groups decreased as SI increased, and contributions of the negative groups increased as SI increased.

