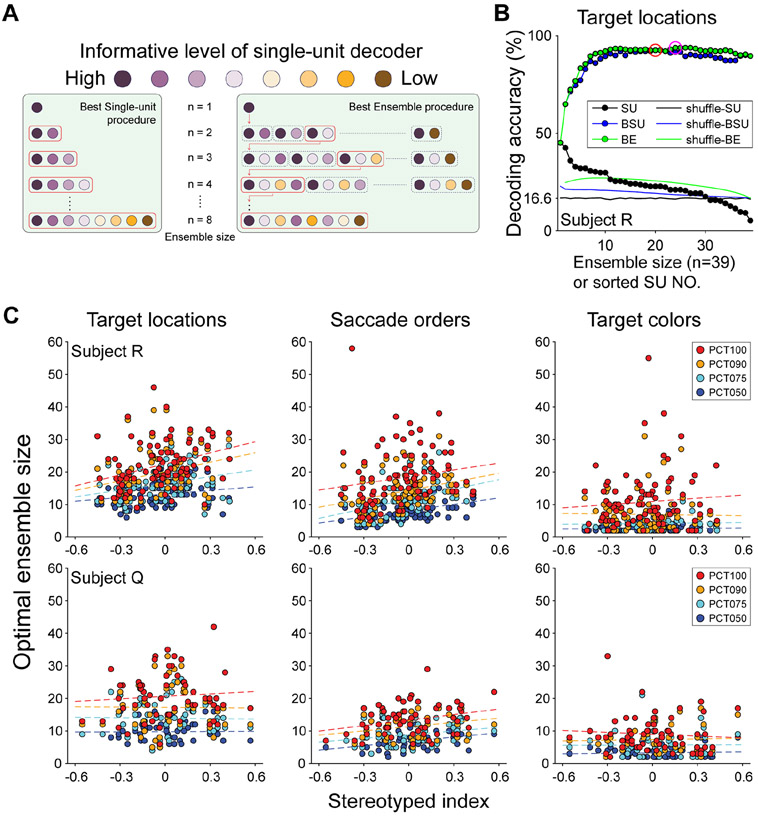
Figure 6.
Optimal ensemble sizes increase with SI. (A) Schematic of BSU and BE procedures adapted from (Backen et al., 2018; Leavitt et al., 2017). In the BSU procedure, the information carried by each neuron is determined by a single-unit decoder, and the ensemble size is gradually increased by iteratively adding units based on their information rank. The BE procedure starts with the most informative neuron then tests all possible combinations of neurons to iteratively select one that produces the maximum decoding performance at that step. (B) Performance of the target location decoder from subject R in an example block. Black symbols show ordered single-unit decoders. Filled circles show BSU (Blue) and BE (Green) accuracies as neurons are added to the ensemble. Red and magenta circles indicated the ensemble size with maximum decoding accuracies for each approach. The same procedures were also used on shuffled data sets (BSU in blue, BE in green, and single unit in black lines, see STAR Methods). Note that BSU and BE procedures selected ensembles optimized to decode real or shuffled data, so that shuffled accuracies are slightly above theoretical chance, as observed in other studies (Backen et al., 2018; Leavitt et al., 2017). The chance level for target location and saccade order decoders was 16.6%, and for target color decoder was 33.3%. (C) Optimal ensemble sizes increase with sequencing. Optimal ensemble sizes at each PCT as a function of SI for target location, saccade order, and target color decoders from two subjects. Ensemble sizes were higher with high SI for task-relevant (location and order), but not irrelevant (color) information.

