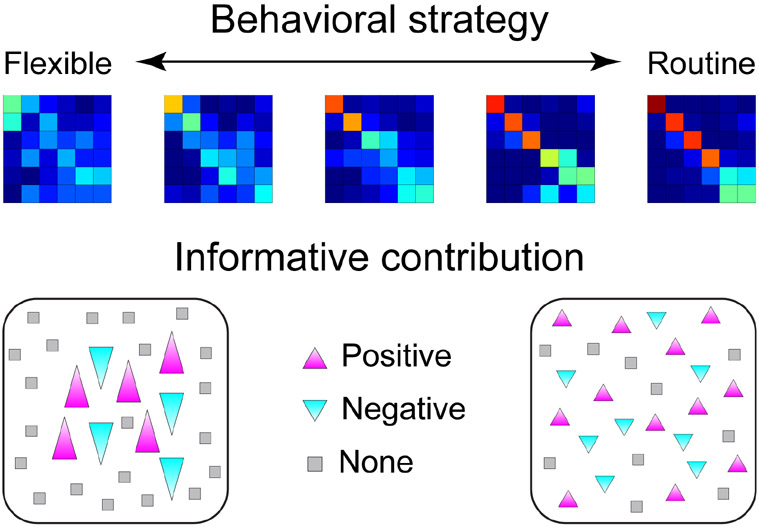
Figure 7.
Sequencing strategies shift information from single units to populations. (Top) Self-generated strategies varied across blocks, from flexible to routine. Selection frequencies for example blocks are similar to Figure 2, with warm colors on the diagonal indicating that selections frequently occur in the same order. (Bottom) Schematic of neural ensembles from the extremes of the flexible-routine spectrum. Triangle size indicates the amplitude of each neuron’s contribution. When strategies are more routine, larger group of units with smaller individual contributions are recruited; otherwise, task information is represented by smaller groups of units with larger individual contributions.

