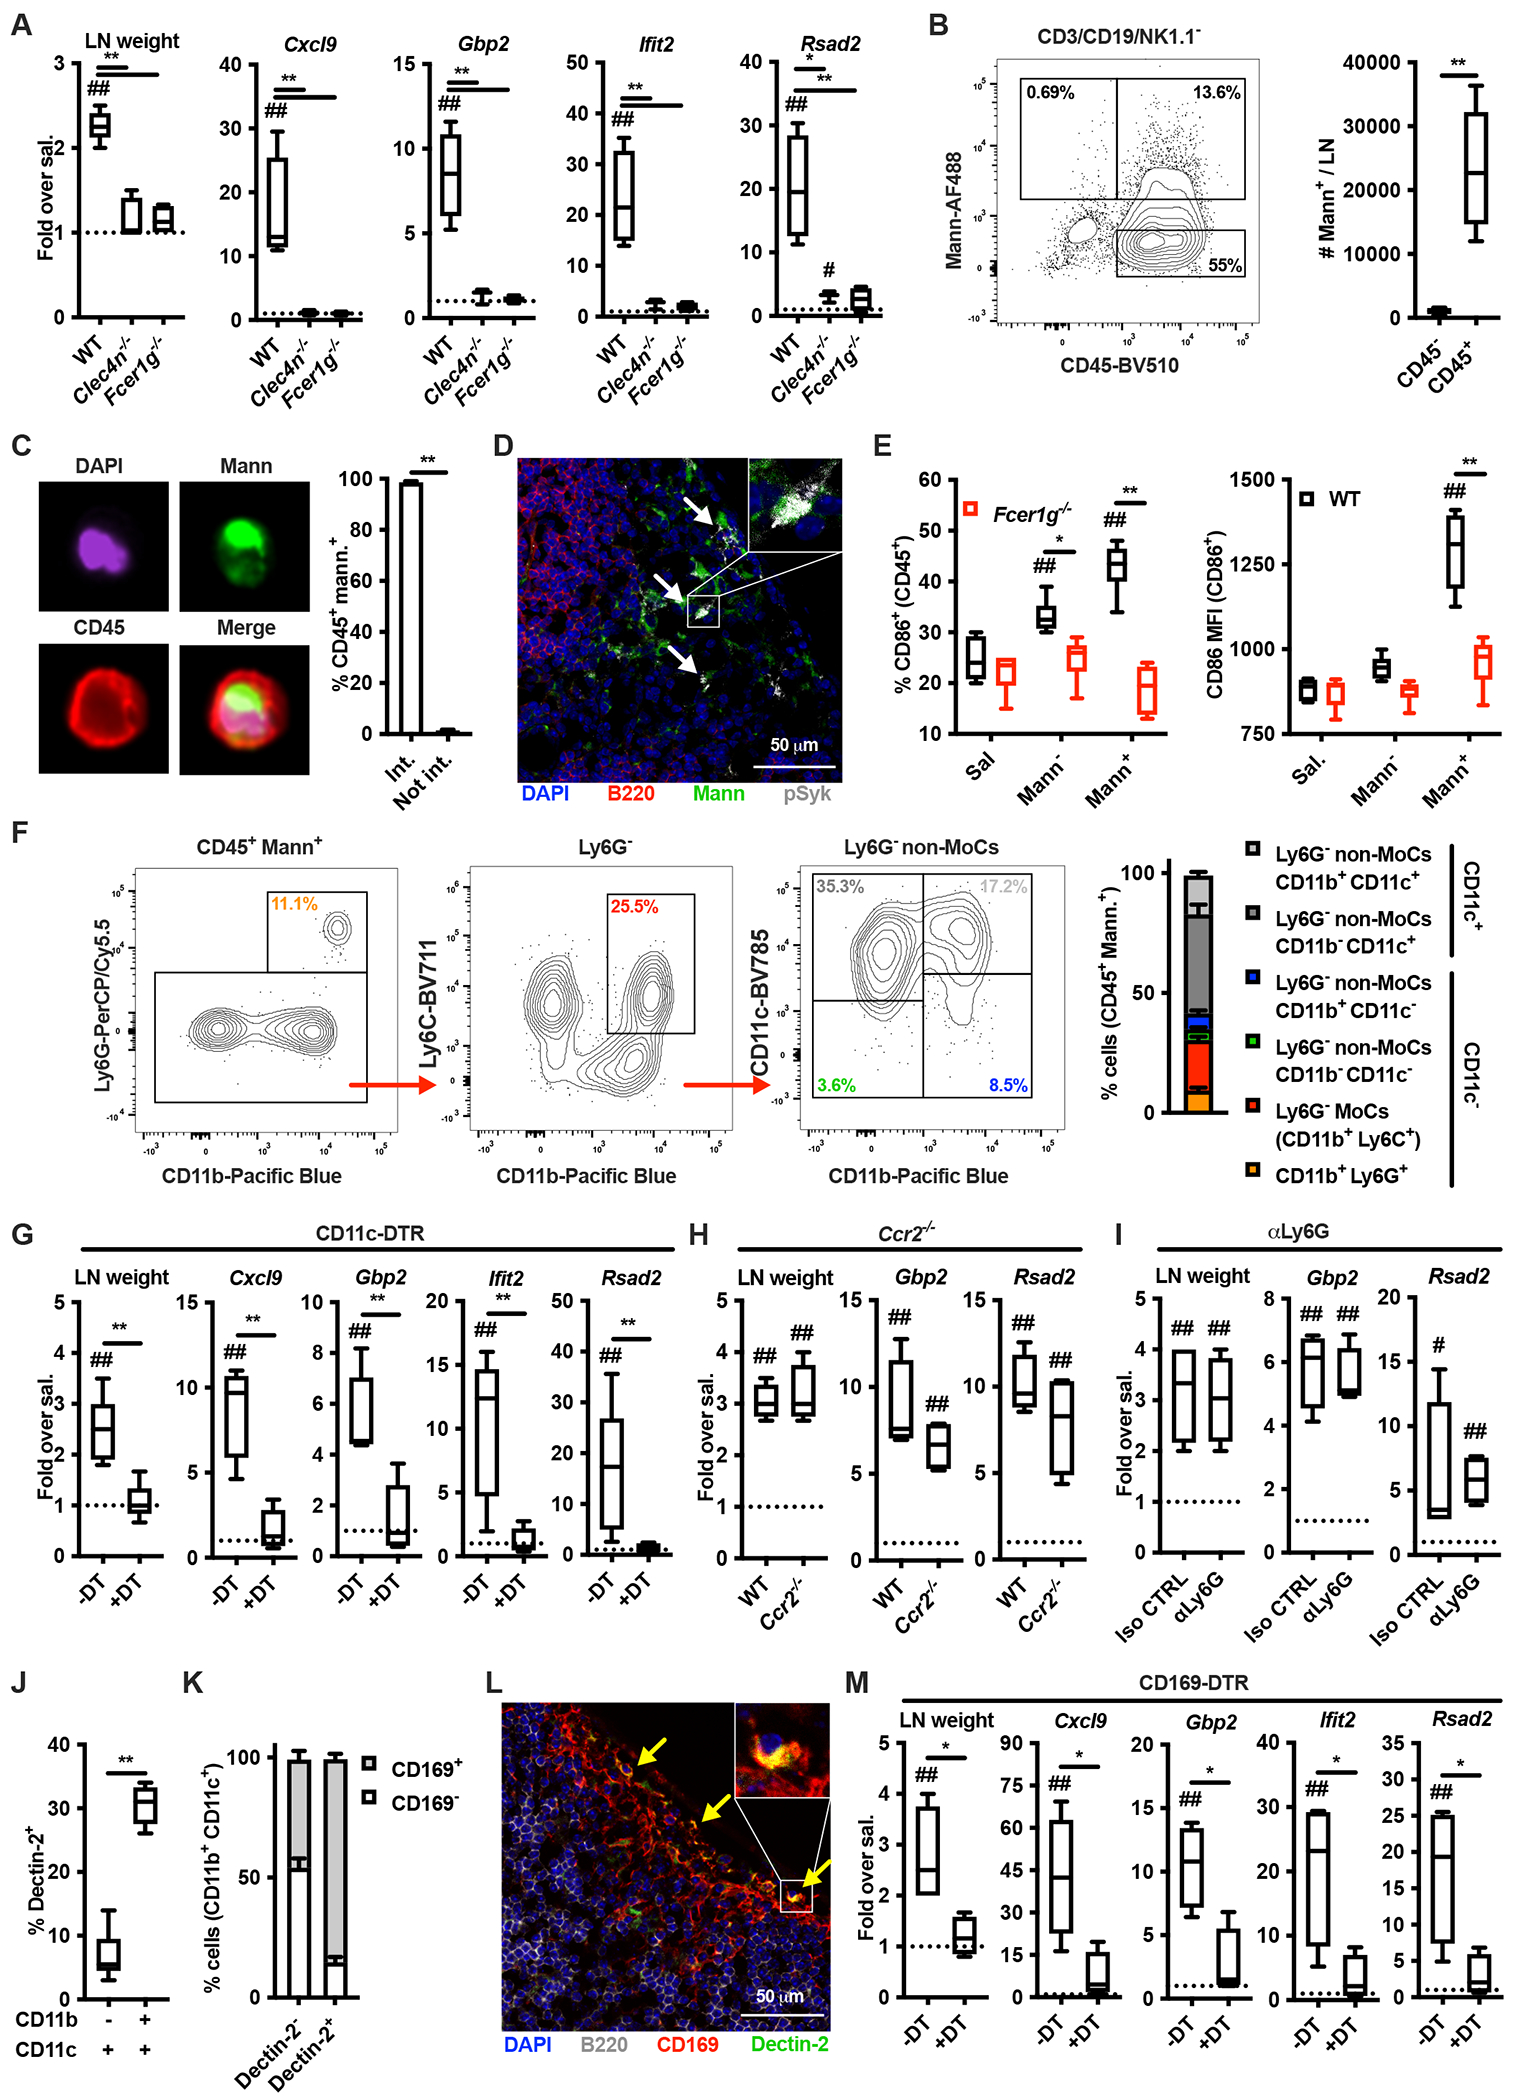
Figure 2. Mannan-elicited lymph node innate response requires Dectin-2-expressing, CD169+ sinus macrophages.

(A) WT, Clec4n−/− and Fcer1g−/− mice were intradermally injected with saline or mannans. 24 hours later dLNs were collected, their weights were measured, and RNA was extracted for gene expression analysis. Results are expressed as fold over contralateral, saline-injected LN. N = 3-5 mice per genotype. (B) WT mice were intradermally injected with fluorescently labelled mannans (Mann-AF488). 6 hours later dLNs were collected and the absolute numbers of mannan-laden (Mann+) CD3/CD19/NK1.1− cells were quantified by flow cytometry. N = 6 mice. (C) Mice were treated as in B. Imaging cytometry analysis and quantification of mannan internalization was performed on CD3/CD19/NK1.1-depeted, CD45+ mannan-laden (Mann+) cells. N = 4 mice. (D) WT mice were intradermally injected with fluorescently labelled mannans (Mann). 1 hour later dLNs were collected for confocal microscopy analysis using antibodies against B220 and phospho-Syk (pSyk). DAPI was used for nuclear counterstaining. One representative image is shown. (E) WT and Fcer1g−/− mice were injected with saline or fluorescently labelled mannans. 6 hours later dLNs were collected and CD86 expression levels were assessed by flow cytometry on CD3/CD19/NK1.1− CD45+ mannan-laden (Mann+) cells, CD45+ cells that did not capture mannans (Mann−) and CD45+ cells from saline-injected dLNs (Sal). N = 6 mice per genotype. (F) WT mice were intradermally injected with fluorescently labelled mannans. 6 hours later dLNs were collected and the phenotype of CD3/CD19/NK1.1− CD45+ mannan-laden (Mann+) cells was assessed by flow cytometry. N = 6 mice. (G - I) Diphtheria toxin (DT)-treated CD11c-DT receptor (DTR), Ccr2−/− and isotype control (Iso CTRL)- or anti-Ly6G (αLy6G)-treated mice were treated and analyzed as in A. N = 4 mice per group. (J, K) LNs were isolated from untreated WT mice and the expression of Dectin-2 was evaluated by flow cytometry as percentage of expression in the indicated CD3/CD19/NK1.1− CD45+ cell subsets. N = 6 for J or 3 for K. (L) Confocal microscopy analysis of untreated LNs stained with antibodies against Dectin-2, B220 and CD169. DAPI was used for nuclear counterstaining. One representative image is shown. (M) DT-treated CD169-DTR mice were treated and analyzed as in A. N = 4 mice per group. # and ## respectively indicate p ≤ 0.05 and 0.01 when comparing each group against the value 1 (which represent the contralateral control sample expressed as fold) or saline control. * and ** respectively indicate p ≤ 0.05 and 0.01 when comparing among different experimental groups.
