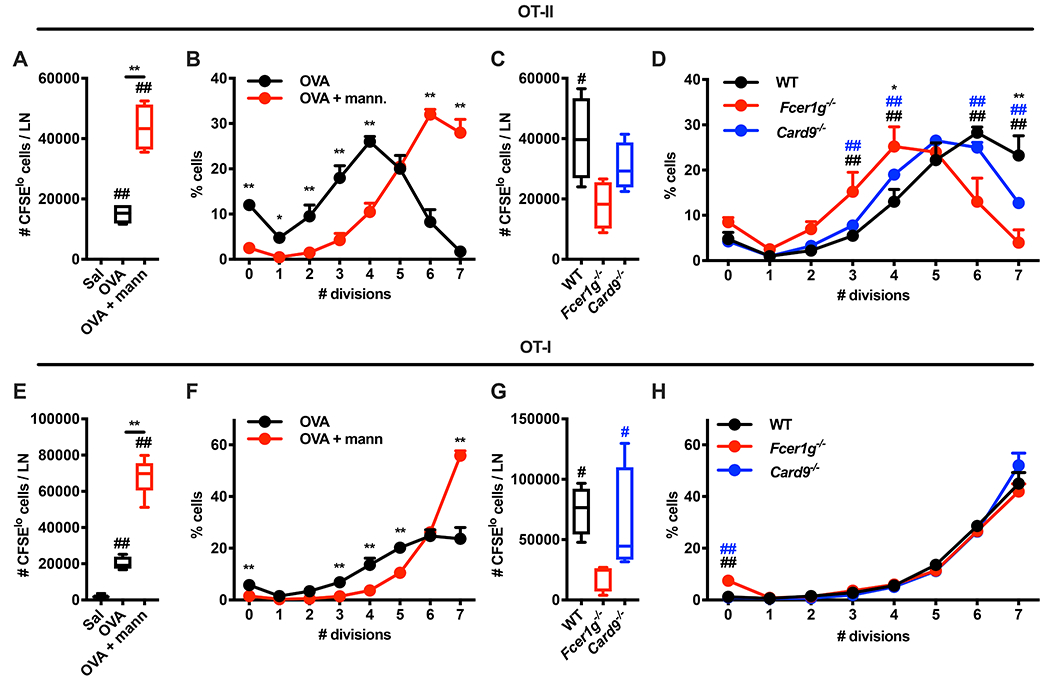
Figure 4. Molecular pathways required for mannan-elicited lymph node innate response regulate the magnitude of mannan adjuvant activity.

(A-H) CFSE-labelled OT-I CD8+ T or OT-II CD4+ T cells were injected intravenously in WT mice on day −1. On day 0 the mice were intradermally injected with saline, ovalbumin (OVA), or OVA combined with mannans (OVA + mann). 3 days later dLNs were isolated and the absolute numbers of CFSElo cells (i.e., cells that underwent at least one cycle of cell division) (A, E) or the percentages of cells in each division peak (B, F) were quantified by flow cytometry. N = 4 mice per group. ## indicates p ≤ 0.01 when comparing each group against saline control (A, E). * and ** respectively indicate p ≤ 0.05 and p ≤ 0.01 when comparing OVA vs OVA + mann. (A, B, E, F). (C, D, G, H) WT, Fcer1g−/− and Card9−/− mice were treated and analyzed as in A, B, E, F (with the exception that all mice received OVA combined with mannans). N = 4 mice per genotype. # and ## respectively indicate p ≤ 0.05 and p ≤ 0.01 when comparing WT vs Fcer1g−/− (black) or Card9−/− vs Fcer1g−/− (blue). * and ** respectively indicate p ≤ 0.05 and 0.01 when comparing WT vs Card9−/−. Results in B, F and D, H are shown as mean + SD.
