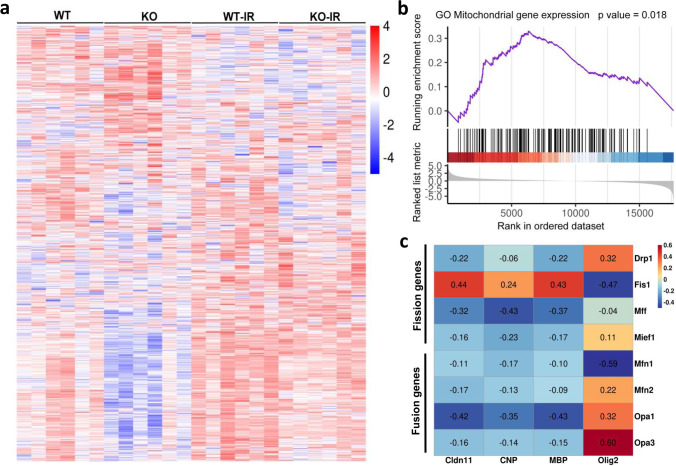
Fig. 5.
Irradiation induces mitochondria-related gene alterations a Heatmap showing the overall distribution of 1109 mitochondria-related genes. b GSEA analysis showed DEGs between WT-irradiated mice and KO-irradiated mice in the GO Mitochondrial gene expression pathway. The top part of each plot shows the enrichment score that represents running-sum statistics calculated by “walking down” the ranked list of genes. The middle part shows the position of a member of a gene set in the ranked list of genes. The bottom part depicts the ranking metric that measures a gene’s correlation with a biological function. c Correlation heatmap for mitochondria fusion and fission-related genes and oligodendrocyte and myelin-related genes between WT-irradiated mice and KO-irradiated mice. Some genes were negatively related and others were positively related as represented in different colors, with red representing positive correlation and blue representing negative correlation. The number in the correlation heatmap is the correlation coefficient.

