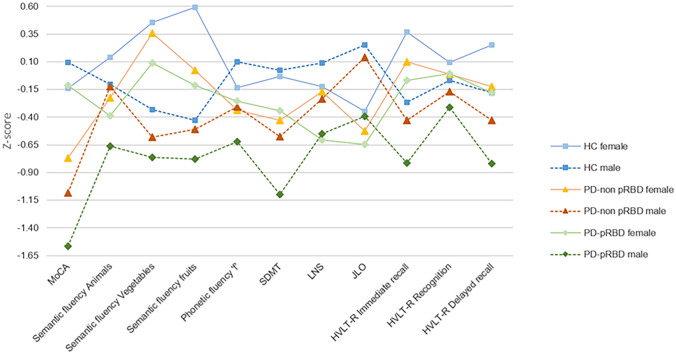
Fig. 1.
Neuropsychological performance. Tasks are indicated in the x axis. Group means in each task are presented as z scores, as indicate in y axis. Lower z scores indicate worse performance. Descriptive statistics, as mean (SD), are available in Supplementary Table 3. Healthy controls in blue, PD-non pRBD in warm colors, PD-pRBD in green; lighter for females and darker for males. HC represented by filled squares, PD-non pRBD by filled triangles and PD-pRBD by filled rhombuses. Females by a continuous line and males by a dashed line. Data are presented as z scores. Abbreviations: MoCA Montreal Cognitive Assessment; SDMT Symbol Digit Modalities Test; LNS Letter-Number Sequencing; JLO Benton Judgment of Line Orientation; HVLT-R Hopkins Verbal Learning Test-Revised, HC healthy controls; PD-non pRBD PD without probable RBD; PD-pRBD PD with probable RBD

