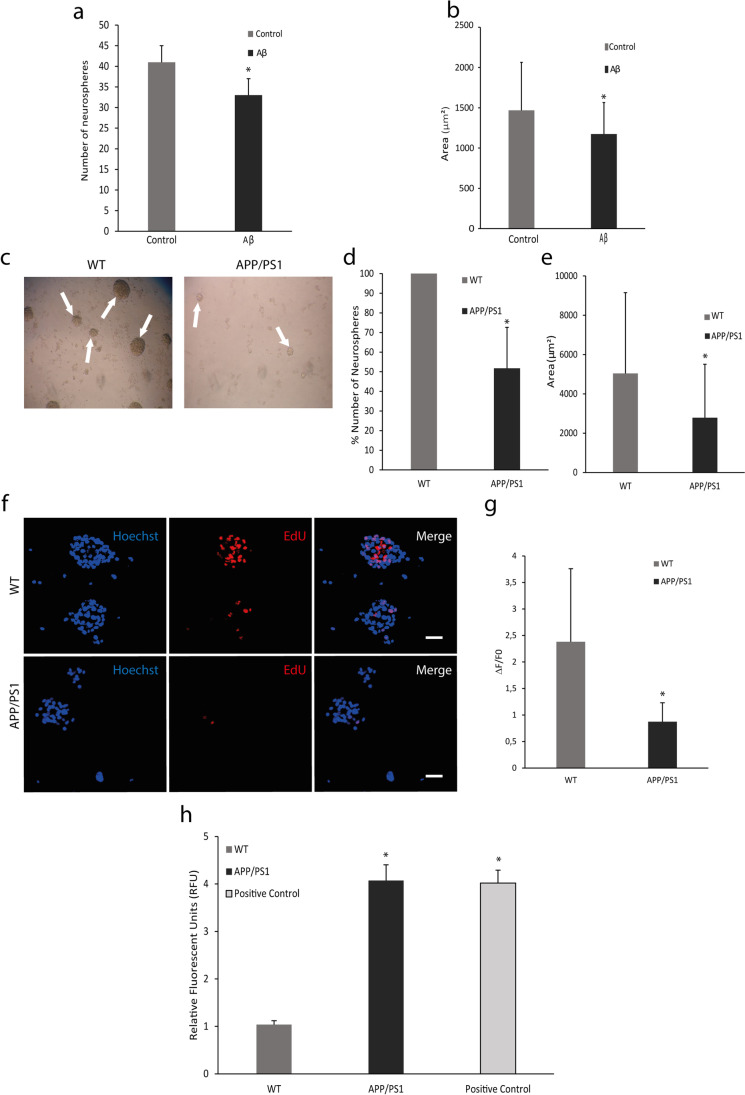
Fig. 1.
Proliferation rate and oxidative stress analysis. (a) Number of neurospheres from V-SVZ are less in the group incubated with 10 μM Aβ respect to the control group. Mean values ± SD. Student’s t test. *p = 0.0001 vs. control (t = 5.527, df = 12). n = 6. (b) Area (μm2) of neurospheres from WT mice shows a decrease after incubation with 10 μM Aβ. Mean values ± SD. Student’s t test. *p = 0.0163 vs. control (t = 2.459, df = 72). n = 6. (c) Representative images of neurospheres from WT and APP/PS1 mice. (d) Number of neurospheres from V-SVZ WT is higher than those from APP/PS1 mice. Mean values ± SD. Student’s t test. *p = 0.0003 vs. WT. (t = 5.974, df = 8). n = 6. (e) Area (μm2) measured in neurospheres decrease in APP/PS1 mice respect to WT. Mean values ± SD. Student’s t test. *p = 1 × 10⁻¹¹ vs. WT (t = 6.895, df = 448). n = 6. (f) Representative images of neurospheres from WT and APP/PS1 mice labelled with EdU in red, which is incorporated to DNA during mitosis, and with Hoechst in blue marking nuclei. Scale bar = 50 μm. (g) Quantification of red fluorescence shows a decreased proliferation rate in neurospheres from APP/PS1 respect to WT. Mean values ± SD. Student’s t test. * p = 0.0098 vs. WT (t = 3.067, df = 12). n = 6. (h) Mitochondrial hydrogen peroxide (H2O2) production in SVZ cells is increased in APP/PS1 mice compared with WT. Mean values ± SD.ANOVA test. * p = 1 × 10⁻⁶ vs. WT (F2,10 = 361.3). n = 3

