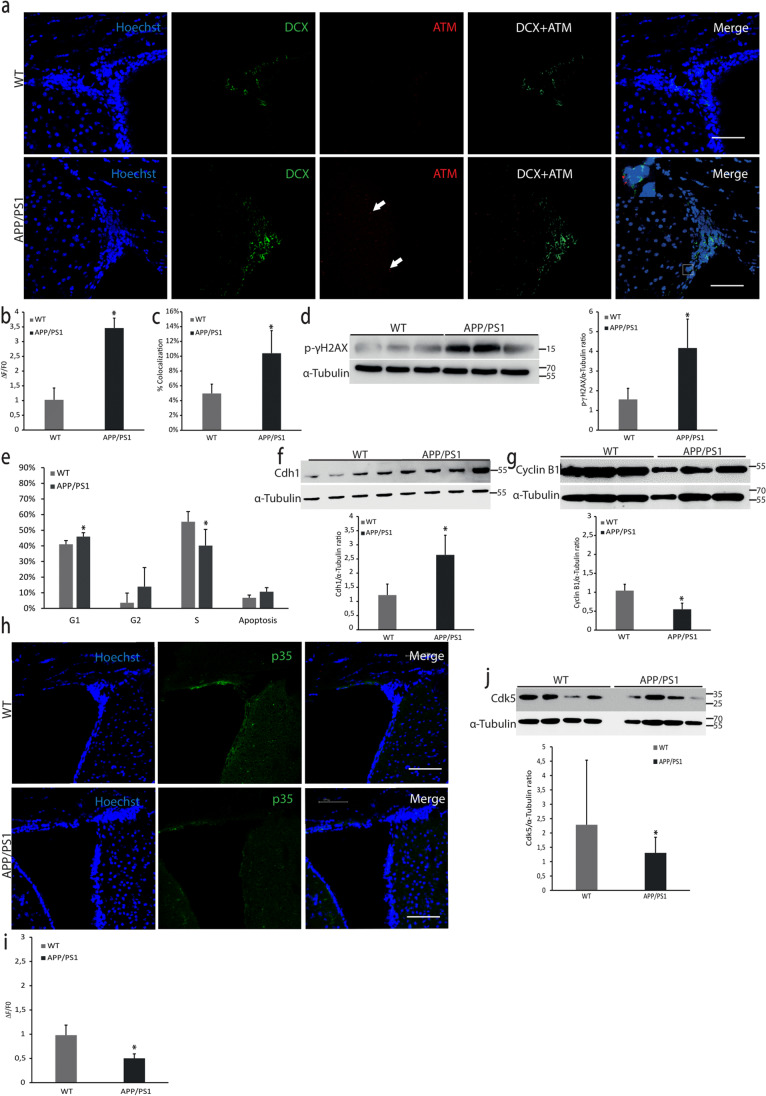
Fig. 3.
DNA damage and cell cycle study. (a) Confocal microscopy analysis of V-SVZ slices from WT and APP/PS1 mice. Anti-ATM in red, anti-DCX in green and nuclei stained with Hoechst in blue. Scale bar = 75 μm. (b) Quantification of red fluorescence fold change shows an increase of ATM content in APP/PS1 mice. Mean values ± SD. Student’s t test. *p = 0.0001 vs WT (t = 11.35, df = 6). n = 3. (c) Quantification of co-localization of ATM+ cells (red) and DCX+ cells (green) indicates that DCX+ cells express more ATM in APP/PS1 mice. Mean values ± SD. Student’s t test. *p = 0.007 vs WT (t = 4.017, df = 6). n = 3. (d) Western blot analysis of p-γH2AX levels in V-SVZ homogenates from WT and APP/PS1 mice. Blots of three independent experiments were quantified by densitometry and normalized with α-tubulin levels. Mean values ± SD are shown. Student’s t test. *p = 0.0066 vs. WT (t = 4.063, df = 6). (e) Flow cytometry characterization of the cell cycle of V-SVZ cells from WT and APP/PS1 mice shows that cells in the S phase are less in APP/PS1 than in WT mice. Mean values ± SD. Student’s t test. *p = 0.0224 vs WT (t = 3.054, df = 6). n = 3. (f) Representative images of western blot of Cdh1 in V-SVZ from WT and APP/PS1 mice. Blots were quantified by densitometry and normalized with α-tubulin levels; mean values ± SD of four independent experiments are shown. Student’s t test. *p = 0.0018 vs. WT (t = 4.595, df = 8). (g) Western blot of cyclin B1 in V-SVZ from WT and APP/PS1 mice. Blots were quantified by densitometry and normalized with α-tubulin levels. Mean values ± SD of three independent experiments are shown. Student’s t test. *p = 0.0021 vs. WT (t = 5.151, df = 6). (h) Representative images of p35 levels (green) in V-SVZ from WT and APP/PS1 mice. Hoechst (blue) was used to identify cell nuclei. Scale bar = 75 μm. (i) Quantification of green fluorescence fold change shows a decrease in the p35 expression in APP/PS1 mice. Mean values ± SD. Student’s t test. *p = 0.0021 vs WT (t = 5.133, df = 6). n = 3. (j) Western blot of Cdk5 levels shows a decrease in V-SVZ from APP/PS1 compared to WT mice. Data are shown as mean values ± SD. Student’s t test. *p = 0.0266 vs WT (t = 2.279, df = 54). n = 4

