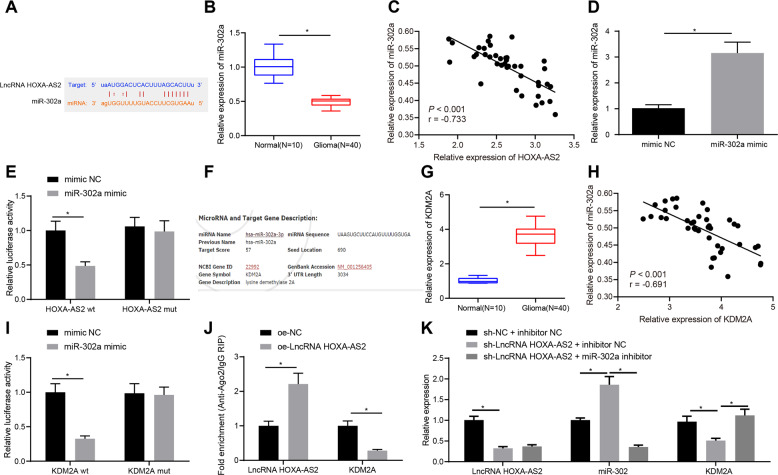
Fig. 3. LncRNA HOXA-AS2 increases KDM2A expression by binding to miR-302a.
A Binding sites of miR-302a on the 3′UTR of lncRNA HOXA-AS2 predicted by the DIANA TOOLS, RAID v2.0 and TargetScan databases. B miR-302a expression in tumor tissues of patients with glioma (N = 40) and normal brain tissues (N = 10) determined by RT-qPCR. C Correlation between miR-302a expression and lncRNA HOXA-AS2 expression in glioma tissues (N = 40) analyzed by Pearson’s correlation coefficient. D miR-302a expression in 293 T cells transfected with miR-302a mimic determined by RT-qPCR. E, miR-302 binding to lncRNA HOXA-AS2 confirmed by dual-luciferase reporter gene assay in 293 T cells. F Binding sites of miR-302a on the 3′UTR of KDM2A mRNA predicted by the DIANA TOOLS, RAID v2.0 and TargetScan databases. G KDM2A expression in glioma tissues (N = 40) and normal brain tissues (N = 10) determined by RT-qPCR. H Correlation analysis between KDM2A expression and miR-302a expression in glioma tissues (N = 40) analyzed by Pearson’s correlation coefficient. I miR-302a binding to KDM2A validated by dual-luciferase reporter gene assay in 293 T cells. J Enrichment of KDM2A and lncRNA HOXA-AS2 analyzed by RIP in 293 T cells. K Expression of lncRNA HOXA-AS2, miR-302a and KDM2A in 293 T cells transfected with sh-lncRNA HOXA-AS2 or combined with miR-302a inhibitor determined by RT-qPCR. *p < 0.05. Data were shown as the mean ± standard deviation. Statistical comparisons were performed using unpaired t-test when only two groups were compared or by one-way ANOVA with Tukey’s post hoc test when more than two groups were compared. Cell experiments were repeated three times.

