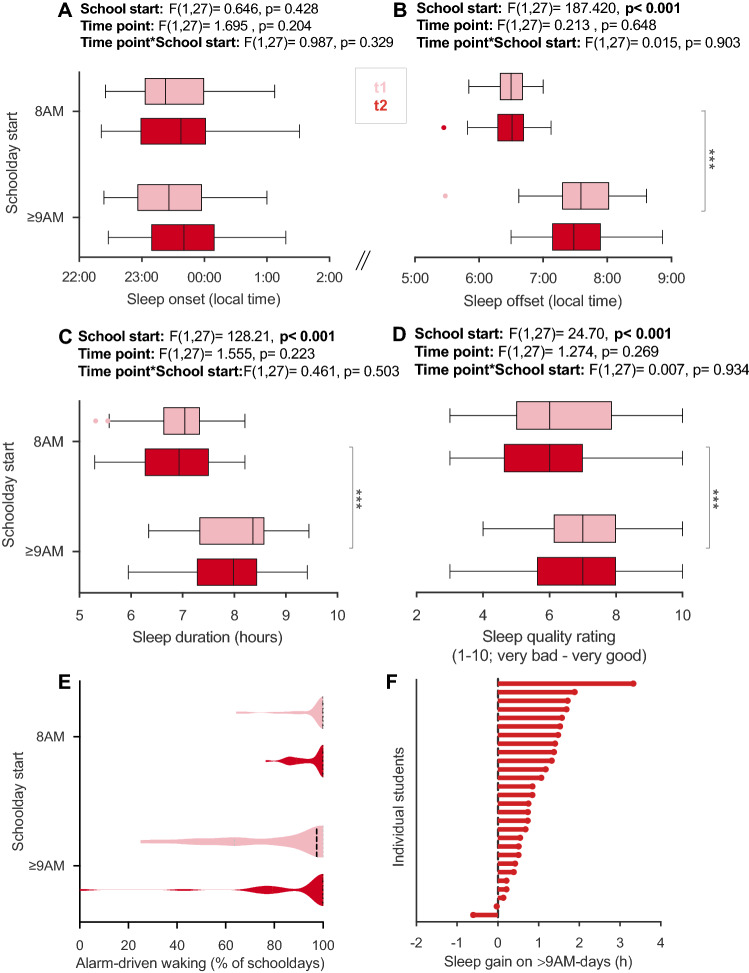
Figure 2.
Comparison of sleep parameters between 8AM-days and ≥ 9AM-days in the flexible system. (A–F) Sleep parameters from the longitudinal cohort (n = 28) comparing 8AM and ≥ 9AM-days at t1 (light red) and t2 (dark red) intra-individually. (A) Average sleep onset, (B) offset, (C) duration, and (D) quality on 8AM versus ≥ 9AM-days in the flexible system across time points. Results of two-way repeated measures ANOVA with the within-subject factors school start (8AM/ ≥ 9AM) and time point (t1/t2) are reported above each graph. Brackets indicate statistically significant post-hoc comparisons. (E) Proportion of schooldays with alarm-driven waking. (F) Sleep gain on ≥ 9AM-days at t2 for each student. Depicted is the absolute difference in average sleep duration between 8AM and ≥ 9AM-days. Positive values mean longer sleep on ≥ 9AM-days. Dashed lines in violin plots show medians. All boxplots are Tukey boxplots. *p < 0.05, **p < 0.01, ***p < 0.001.

