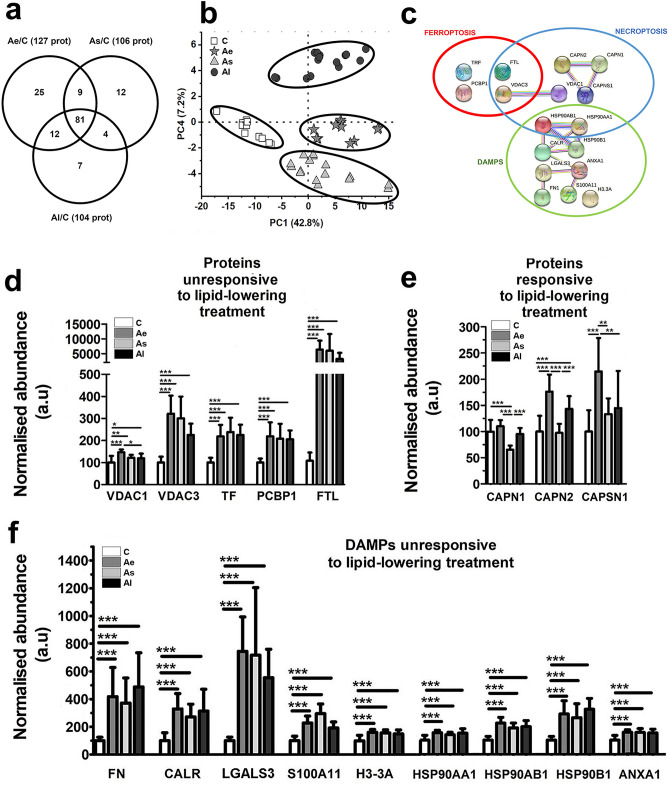
Figure 4.
The global proteomic analysis of the aortic homogenates extracted from all animals included in this study. (a) Venn diagram revealing the number of differentially abundant proteins over the control in Ae, As, and Al atherosclerotic groups. All sets of experiments were performed in technical duplicates. (b) Mass spectrometry data of the differentially abundant proteins from aortic homogenate extracts analyzed by PCA plots showing the spatially disparate protein profiles of Ae, As, Al atherosclerotic groups compared to control, C. (c) Protein interaction networks identified in differential proteomes of aortic tissue from all animals correlated with regulated death KEGG pathways (ferroptosis and necroptosis) and DAMPs' associated release as predicted by STRING bioinformatic tool. Nodes represent individual proteins belonging to cell death pathways (ferroptosis and necroptosis) and to the DAMPs associated proteins identified by mass spectrometry (encircled in red, blue and green, respectively). Node annotations in clusters mean: VDAC1 (voltage-dependent anion-selective channel protein 1), VDAC3 (Voltage-dependent anion-selective channel protein 3), TF (serotransferrin), PCBP1 (poly (RC) -binding protein 1), FTL (Ferritin light chain), CAPSN1 (Calpain small subunit 1), CAPN2 (Calpain-2 subunit catalytic), CAPN1 (Calpain-1 catalytic subunit), CAPSN1 (Calpain small subunit 1), HSP90AA1 (Heat shock protein HSP 90-alpha), HSP90AB1 (Heat shock protein HSP 90-beta), ANXA1 (annexin A1), LGALS3 (galectin 3), HSP90B1 (endoplasmin), S100A11 (protein S100A11), FN (fibronectin), CALR (calreticulin), H3-3A (histone H3.3). The normalized abundance changes of the identified proteins induced by hyperlipidemia implicated in KEGG inter-relation map of ferroptosis and necroptosis pathways. Proteins are divided into two groups: (d) proteins unresponsive to lipid-lowering treatment: VDAC1, VDAC3, TF, PCBP1, FTL and (e) proteins responsive to lipid-lowering treatment: CAPN1, CAPN2, CAPSN1. (f) Histograms showing the differentially abundant DAMPs quantified in the ascending aorta samples of C, Ae, As and Al groups, using label-free relative mass spectrometric analysis: FN, CALR, LGALS3, S100A11, H3-3A, HSP90AA1, HSP90AB, HSP90B1, ANXA1. C: control group (n = 7), Ae: early atherosclerotic group (n = 6), As: stabilized atherosclerotic group with lower lipid treatment (n = 8), Al: late atherosclerotic group (n = 8). Data represent the mean ± SD; *p < 0.05; **p < 0.01; ***p < 0.001).

