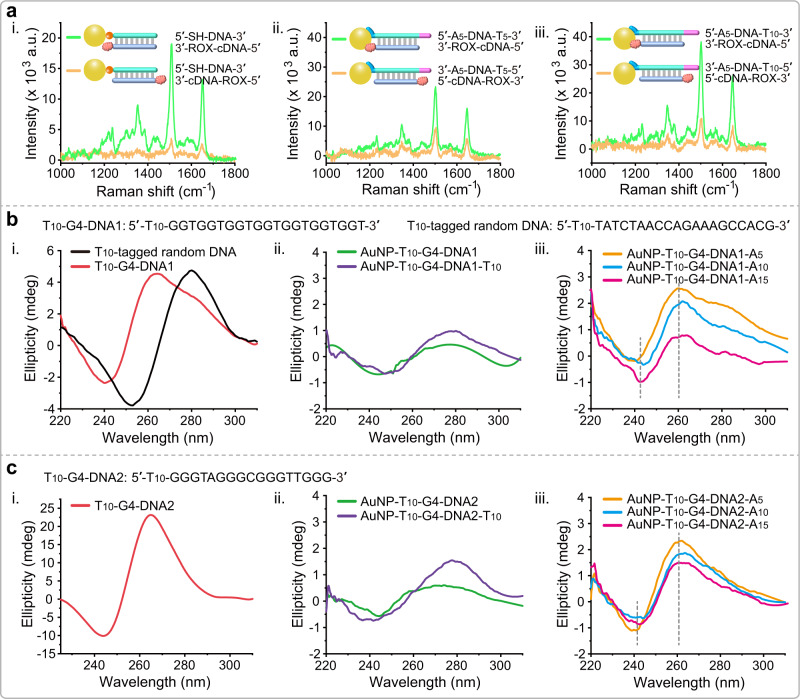
Fig. 3. Spectroscopic observation of poly (T) tag orientation in the SNA structure.
a (i) SERS experiments showing the Raman signal variation when cDNAs labeled with ROX at 5′- and 3′-terminal hybridized with the SH-DNA-AuNP conjugates, respectively. (ii) SERS experiments showing the Raman signals variation when cDNA labeled with ROX at 3′-terminal hybridized with the A5-DNA-T5 and T5-DNA-A5 conjugated AuNP probes, respectively. (iii) SERS experiments showing the Raman signal variation when cDNA labeled with ROX at 3′-terminal hybridized with the A5-DNA-T10 and T10-DNA-A5 conjugated AuNP probes, respectively. For all SERS experiments, 30 nm diameter AuNPs are used. a.u. arbitrary units. b (i) CD spectra of the T10-tagged G4-DNA1 sequence and T10-tagged random DNA sequence. G4-DNA1 sequence has two characteristic peaks at around 240 and 260 nm. Random DNA sequence has two characteristic peaks at around 250 and 280 nm. (ii) CD spectra of AuNP-T10-G4-DNA1 and AuNP-T10-G4-DNA1-T10 conjugates. (iii) CD spectra of AuNP-T10-G4-DNA1-A5, AuNP-T10-G4-DNA1-A10, and AuNP-T10-G4-DNA1-A15 conjugates. c (i) CD spectra T10-tagged G4-DNA2 sequence. (ii) CD spectra of AuNP-T10-G4-DNA2 and AuNP-T10-G4-DNA2-T10 conjugates. (iii) CD spectra of AuNP-T10-G4-DNA2-A5, AuNP-T10-G4-DNA2-A10, and AuNP-T10-G4-DNA2-A15 conjugates. mdeg millidegree.

