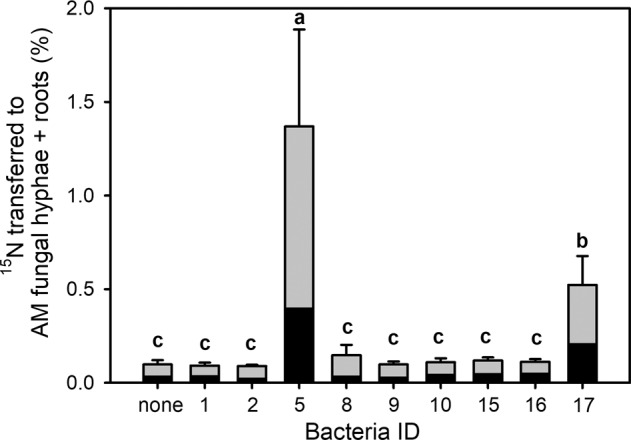
Fig. 4. Transfer rates of 15N-labelled nitrogen applied into the labelling compartment in the form of chitin to the roots (grey bars) or to the mycorrhizal hyphae in the root-free zone of the large Petri dish (black bars) in Experiment 1.

Only results from mycorrhizal microcosms are included in this analysis. Shown are mean values (and standard deviations) of 4–6 replicates per treatment of the total 15N-transfer values (i.e. excess 15N contained in the roots and their attached mycorrhizal fungal hyphae). Different letters indicate significant differences between treatment means with respect to the amount of 15N-labelled nitrogen applied as chitin into the labelling compartment and transferred to the roots and their attached mycorrhizal fungal hyphae, expressed as percentage of total 15N supplied in the labelling compartment. Means were separated by Duncan’s post-hoc test (p < 0.05), following significant ANOVA (F9,50 = 27.3, p < 0.001). Data were log(x + 0.1) transformed prior to ANOVA.
